Late last week the Advocates for Highway and Auto Safety, the International Brotherhood of Teamsters, Parents Against Tired Truckers (PATT) and Citizens for Reliable and Safe Highways (CRASH) filed a petition with the United States Court of Appeals for the District of Columbia Circuit seeking to invalidate proposed HoS rule changes. “Some thought the 60-day litigation window on these rules had already closed (since the rule was published on June 1),” said Dave Osiecki, President and CEO of Scopelitis Transportation Consulting, “but the 60 days actually started when FMCSA denied in early September the AHAS/Teamster petition for reconsideration of the rule changes”. A very fluid situation arising just one week from the proposed implementation date.
For motor carriers, this court challenge won’t come as a surprise, but many were excited at the prospect of flexible HoS rules based on very productive discussions between the FMCSA and drivers in recent years. The proposed rule changes included an expanded split-sleeper berth option that would let drivers effectively stop their 14-hour clock for up to three hours in a duty shift, allow them to satisfy the 30-minute break requirement through on-duty non-driving activities, extend the adverse driving conditions exception by two hours, expand the short-haul exemption workday limit from 12 to 14 hours and the expand the radios of operation from 100 air miles to 150 air miles (ELD devices are not required with this radius of operation).
Regardless of the outcome, carriers and drivers should make sure their ELD provider is ready to implement the new rules whenever they are introduced. Most importantly, carriers need to know how and when the over-the-air firmware upgrade will take place, so unnecessary delays can be avoided.
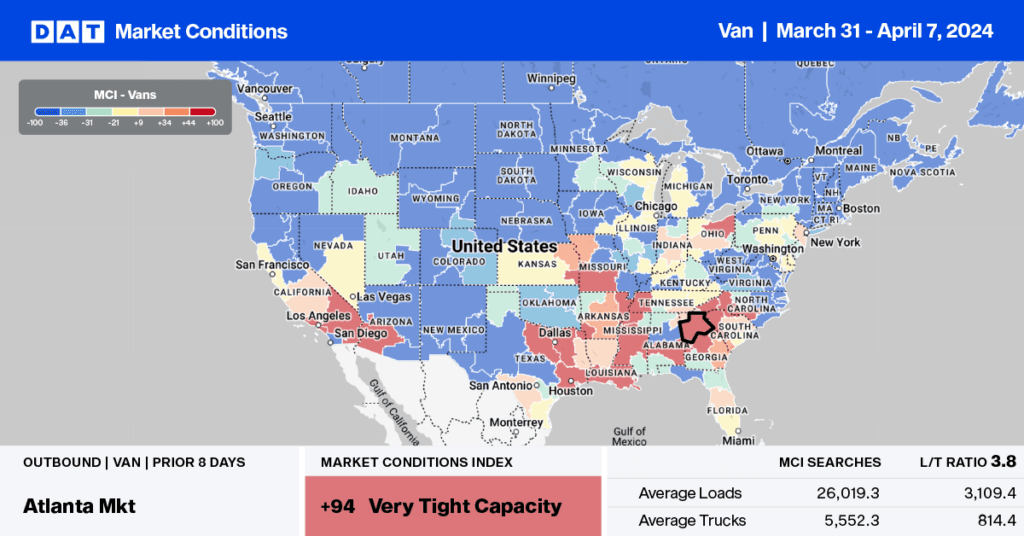
Dry van trends
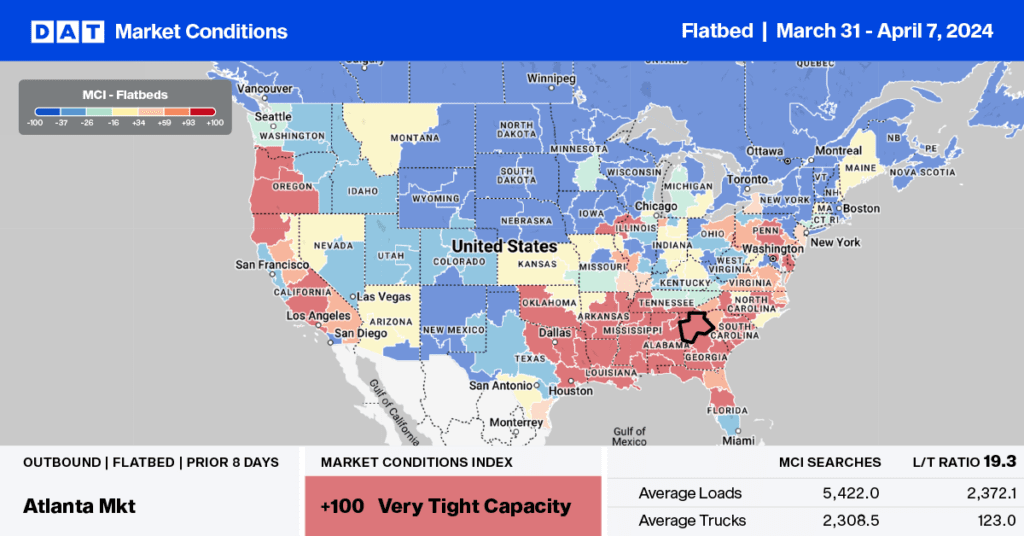
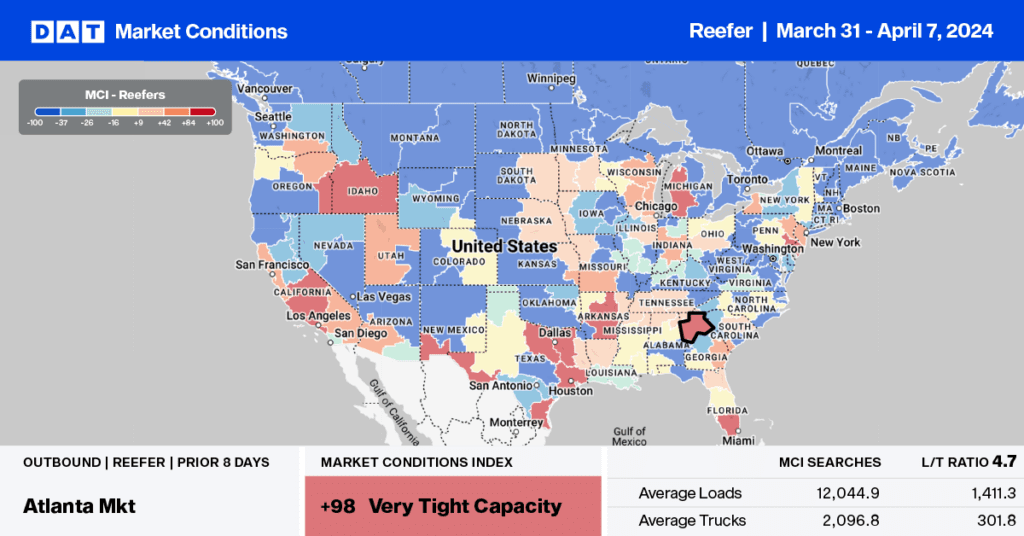
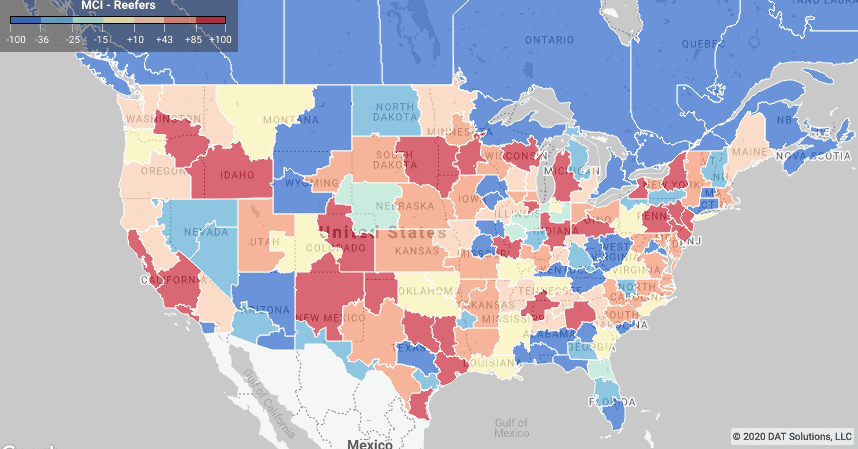
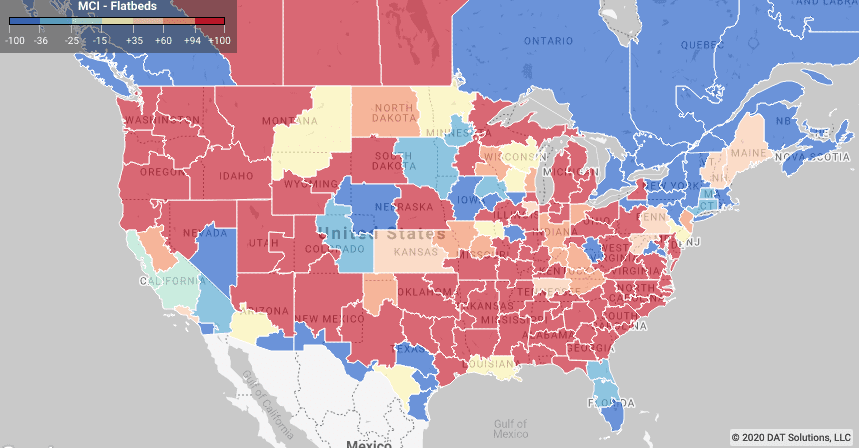
Market Condition Index (MCI)
According to data from the FMCSA, the number of interstate carriers at the end of August had grown by just under 1% YTD adding 33,228 trucks to the national fleet count (for all types and modes). Even though capacity has been added across the board since the pandemic took effect, some fleet demographics have increased capacity substantially while others have shed capacity.
The largest increase in capacity was in the owner-operator category, which added 11,851 trucks (29% of total) since April 1, after being flat in the first quarter. In fact, two-thirds of trucks added to the market came from fleets in the one to 66 truck category. The increase in owner-operator truck count was largely offset by the reduction in capacity in the 5,000 to 16,000 truck category, which shed 11,620 trucks recording a 4.6% YTD decrease in capacity.
On the demand side, load board activity was higher again last week with the Hurricane-affected markets in Florida and the Gulf Coast getting back to normal and posting a 22% w/w increase in volume. On the West Coast, volumes in Ontario and Los Angeles posted a 16% w/w increase, while further north in San Francisco volumes climbed 18% w/w. Houston reported the largest gain with a 30% w/w increase in outbound load posts.
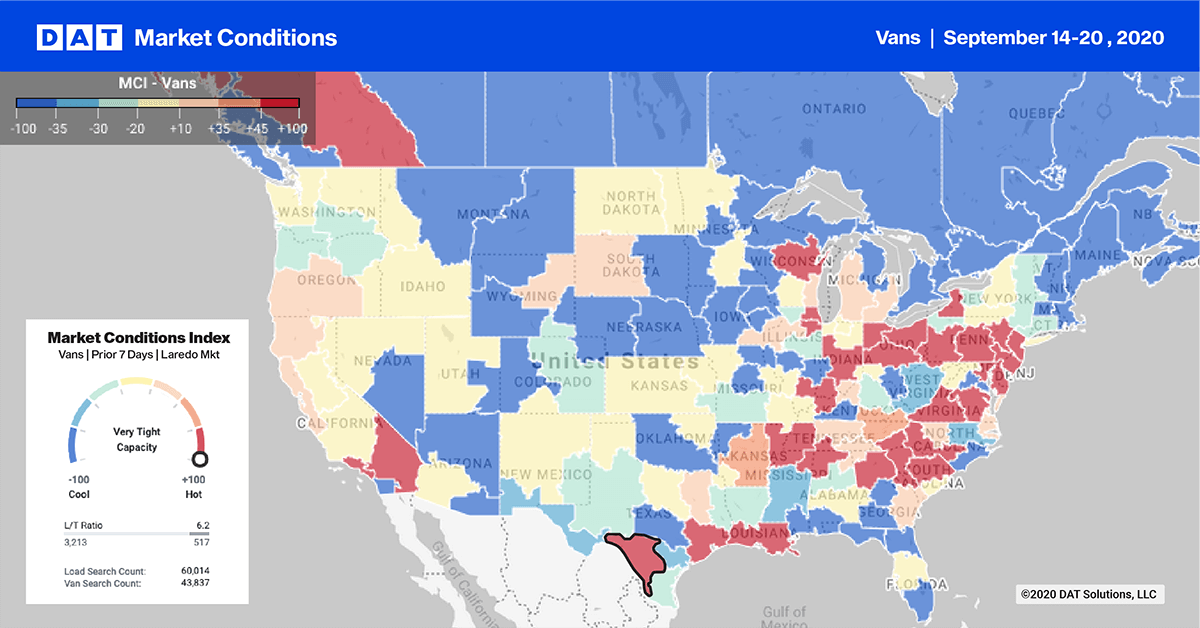
> Learn more about the Market Conditions Index
Spot van rates
Spot market rates inched higher again last week moving up 3% w/w to $2.22/mile, which is 43% higher than this time last year when rates were at $1.55/mile. Last week’s dry van rates are the highest recorded in the last five years as the current dry van spot market rate rally enters its 21st week after bottoming out at $1.32/mile on May 1. Spot rates have increased $0.90/mile since then and are now $0.15/mile higher than the highest recorded rate in 2018 when we experienced the tightest capacity observed in a decade.
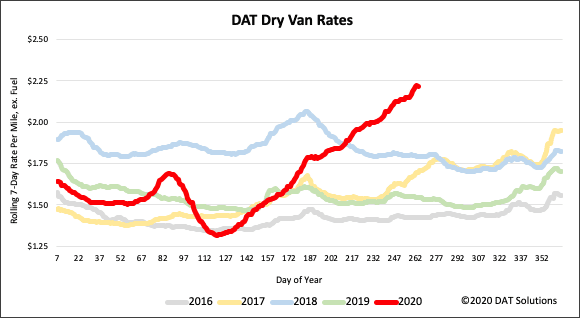
National average rates provided by DAT iQ.
Reefer trends
USDA domestic truckload shipments of produce are down 27% since the summer volume peak on June 27th, as well as down 25% for imports. Fall marks the shift to more imported produce for specialty crops to meet consumer demand for winter produce and for carriers this means a shift from hauling produce predominantly for domestic growers to imports from countries including Morocco and Chile for citrus, blueberries and grapes. This changes the freight patterns for reefer carriers, from being farm-centric to port-based along the east and west coasts, with a few exceptions. During winter, demand for leafy green produce shifts from Southern California to Yuma AZ, or “The Winter Salad Bowl” as it is known in the produce industry. Produce volumes in Yuma are captured in the Ontario freight market, but since 90% of U.S. demand for leafy green crops comes from Yuma, it’s an important one to watch for reefers looking to load east, in addition to watching port markets such as Los Angeles, Houston and Philadelphia.
Along the southern border volumes from Mexico and the Rio Grande Valley are also on the rise; most commercial crossing zones reported higher outbound volumes last week with Tucson leading the way with a 36% w/w increase in load post volumes. El Paso, Laredo and McAllen recorded 11%, 20% and 16% w/w increases respectively. Offsetting reduced produce volume this season has been frozen food sales, which are up 18% y/y – this represents 26 weeks of double-digit dollar sales growth. According to IRI, “as seen throughout the pandemic, no matter how strong the fresh and total store performance, frozen foods have been outperforming other temperature zones handily”.
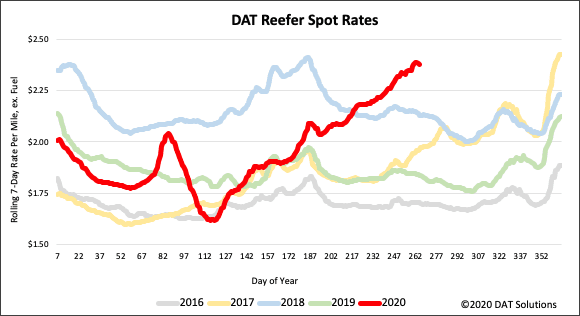
Spot Rates
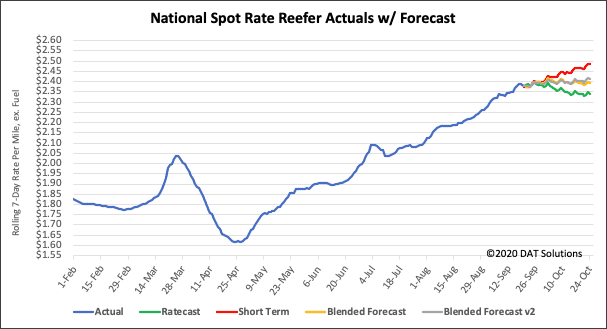
National average reefer rates increased slightly last week moving up by just 1% to $2.38/mile. This is still the highest level in the last five years for September and just $0.03/mile lower than the highest level recorded in 2018 of $2.41/mile on July 1.
Flatbed trends
Flatbed carriers have played a major role over the summer hauling thousands of loads of lumber and building materials for the housing industry, which continues to lead the economic recovery. Fueled by record-low interest rates and demand for suburban properties as many workers transition to working from home, single family housing starts (the most freight intensive home type) increased 4% m/m in August, which now has this category up 12% y/y. The Southeast, where around 55% of single-family homes are built, recorded a 4% m/m increase in August followed by the Midwest region, which jumped 20% m/m (14% of national total). The West region, which is the second largest at 24% of total single family homes built, recorded a 22% m/m while in the Northeast (6% of national total) reversed course dropped 23% m/m. Looking ahead, the National Association of Home Builders’ (NAHB) monthly confidence index, which measures sentiment regarding prospective buyer traffic, reached the highest monthly reading on record in the 35-year history of the data series. According to NAHB Chief Economist Robert Doetz, “lumber prices are now up more than 170% since mid-April, adding more than $16,000 to the price of a typical new single-family home”.
Spot Rates
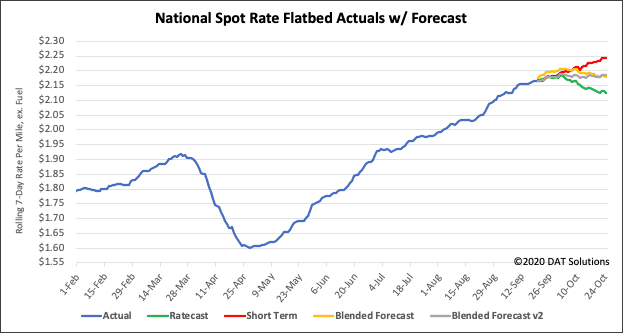
Flatbed spot rates stayed relatively flat last week ending the week up by just $0.01/mile to reach $2.17/mile. Flatbed rates are still hovering around where they were in 2018 for this time of the year but are still $0.25/mile lower than the highest rate observed in 2018.
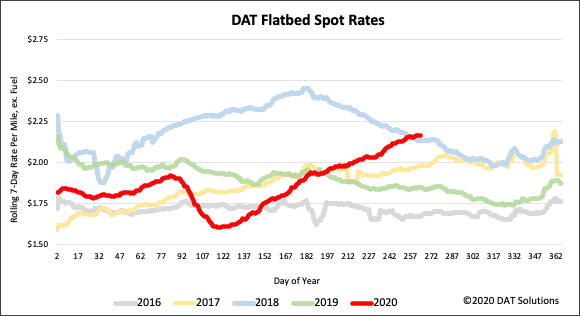
Understanding Rate Trend Charts
The graphs above and below show 3-day and 7-day rolling, weighted averages of spot truckload rates, updated daily, and illustrated by year. The average helps to smooth out day-of-week effects, but it is plotted daily to show how things are changing in the extreme near term. DAT does not typically publish rates in this format, and as such, they will not match other figures that customers may be familiar with in our blog or other content. We are making these available to the public to help demonstrate the rapidity of changes occurring in the spot market.
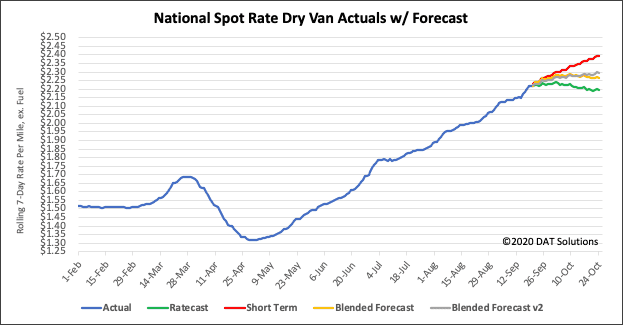
Understanding Rate Forecast Charts
It warrants mentioning that forecasting during this volatile and uncertain time period is difficult. Our team is working diligently to update and adjust the models, but new information becomes available at a rapid pace, which further complicates the issue. DAT would typically not publish these types of preliminary studies, but we feel that the benefit of sharing our observations far outweighs the risk. We ask that you please treat these statements and exhibits as directional and consider them as a variable in your own analyses.
How to interpret the rate forecast
- Ratecast Prediction: DAT’s core forecasting model estimate showing continued optimism and rate growth.
- Short Term Scenario: Formerly the pessimistic model that focuses on a more near-term historical dataset.
- Blended Scenario: More heavily weighted towards the longer-term models.
- Blended Scenario v2: More heavily weighted towards the shorter-term models.
Need more information….
Our update will be refreshed next week, or sooner if conditions change materially. We recommend that readers visit dat.com/MarketUpdate for the latest information. Any questions on this report or market conditions can be emailed to askIQ@dat.com.
We are also making available, free of charge, the DAT Daily 50 which is a daily report of the top 50 lanes by volume with a week’s worth of history and predictions using the Ratecast model.