In this week’s What-if Wednesday post, Arkieva Supply Chain Optimization Consultant – Abhishek Shah – shares the results of a what-if demand forecast simulation using the Winters statistical forecasting method.

In the previous blog, we experimented with Alpha – the intercept parameter of Holt-Winters method – to see how the forecast gets affected as the weight changes from 0.05 to 0.8.
This week we are going to run similar tests with Beta, the trend parameter. We will use the same historical dataset for our analysis. As we discussed in the last post about Alpha, Beta can also take values ranging from 0 to 1; and the larger the value of Beta the more weightage is on the recent historical trend.
For our analysis, we will keep the alpha value at 0.05 and will vary the Beta value from 0.05 to 0.8 and evaluate how the forecast changes. You can see the numbers at the end of the post.
The first chart below shows historically observed values from the last three years and the subsequent graphs represent forecasts using a Beta value of 0.05, 0.1, 0.2, 0.4 and 0.8.
Statistical Forecasting Method: Holt-Winters Multiplicative Beta Parameter Simulation Results
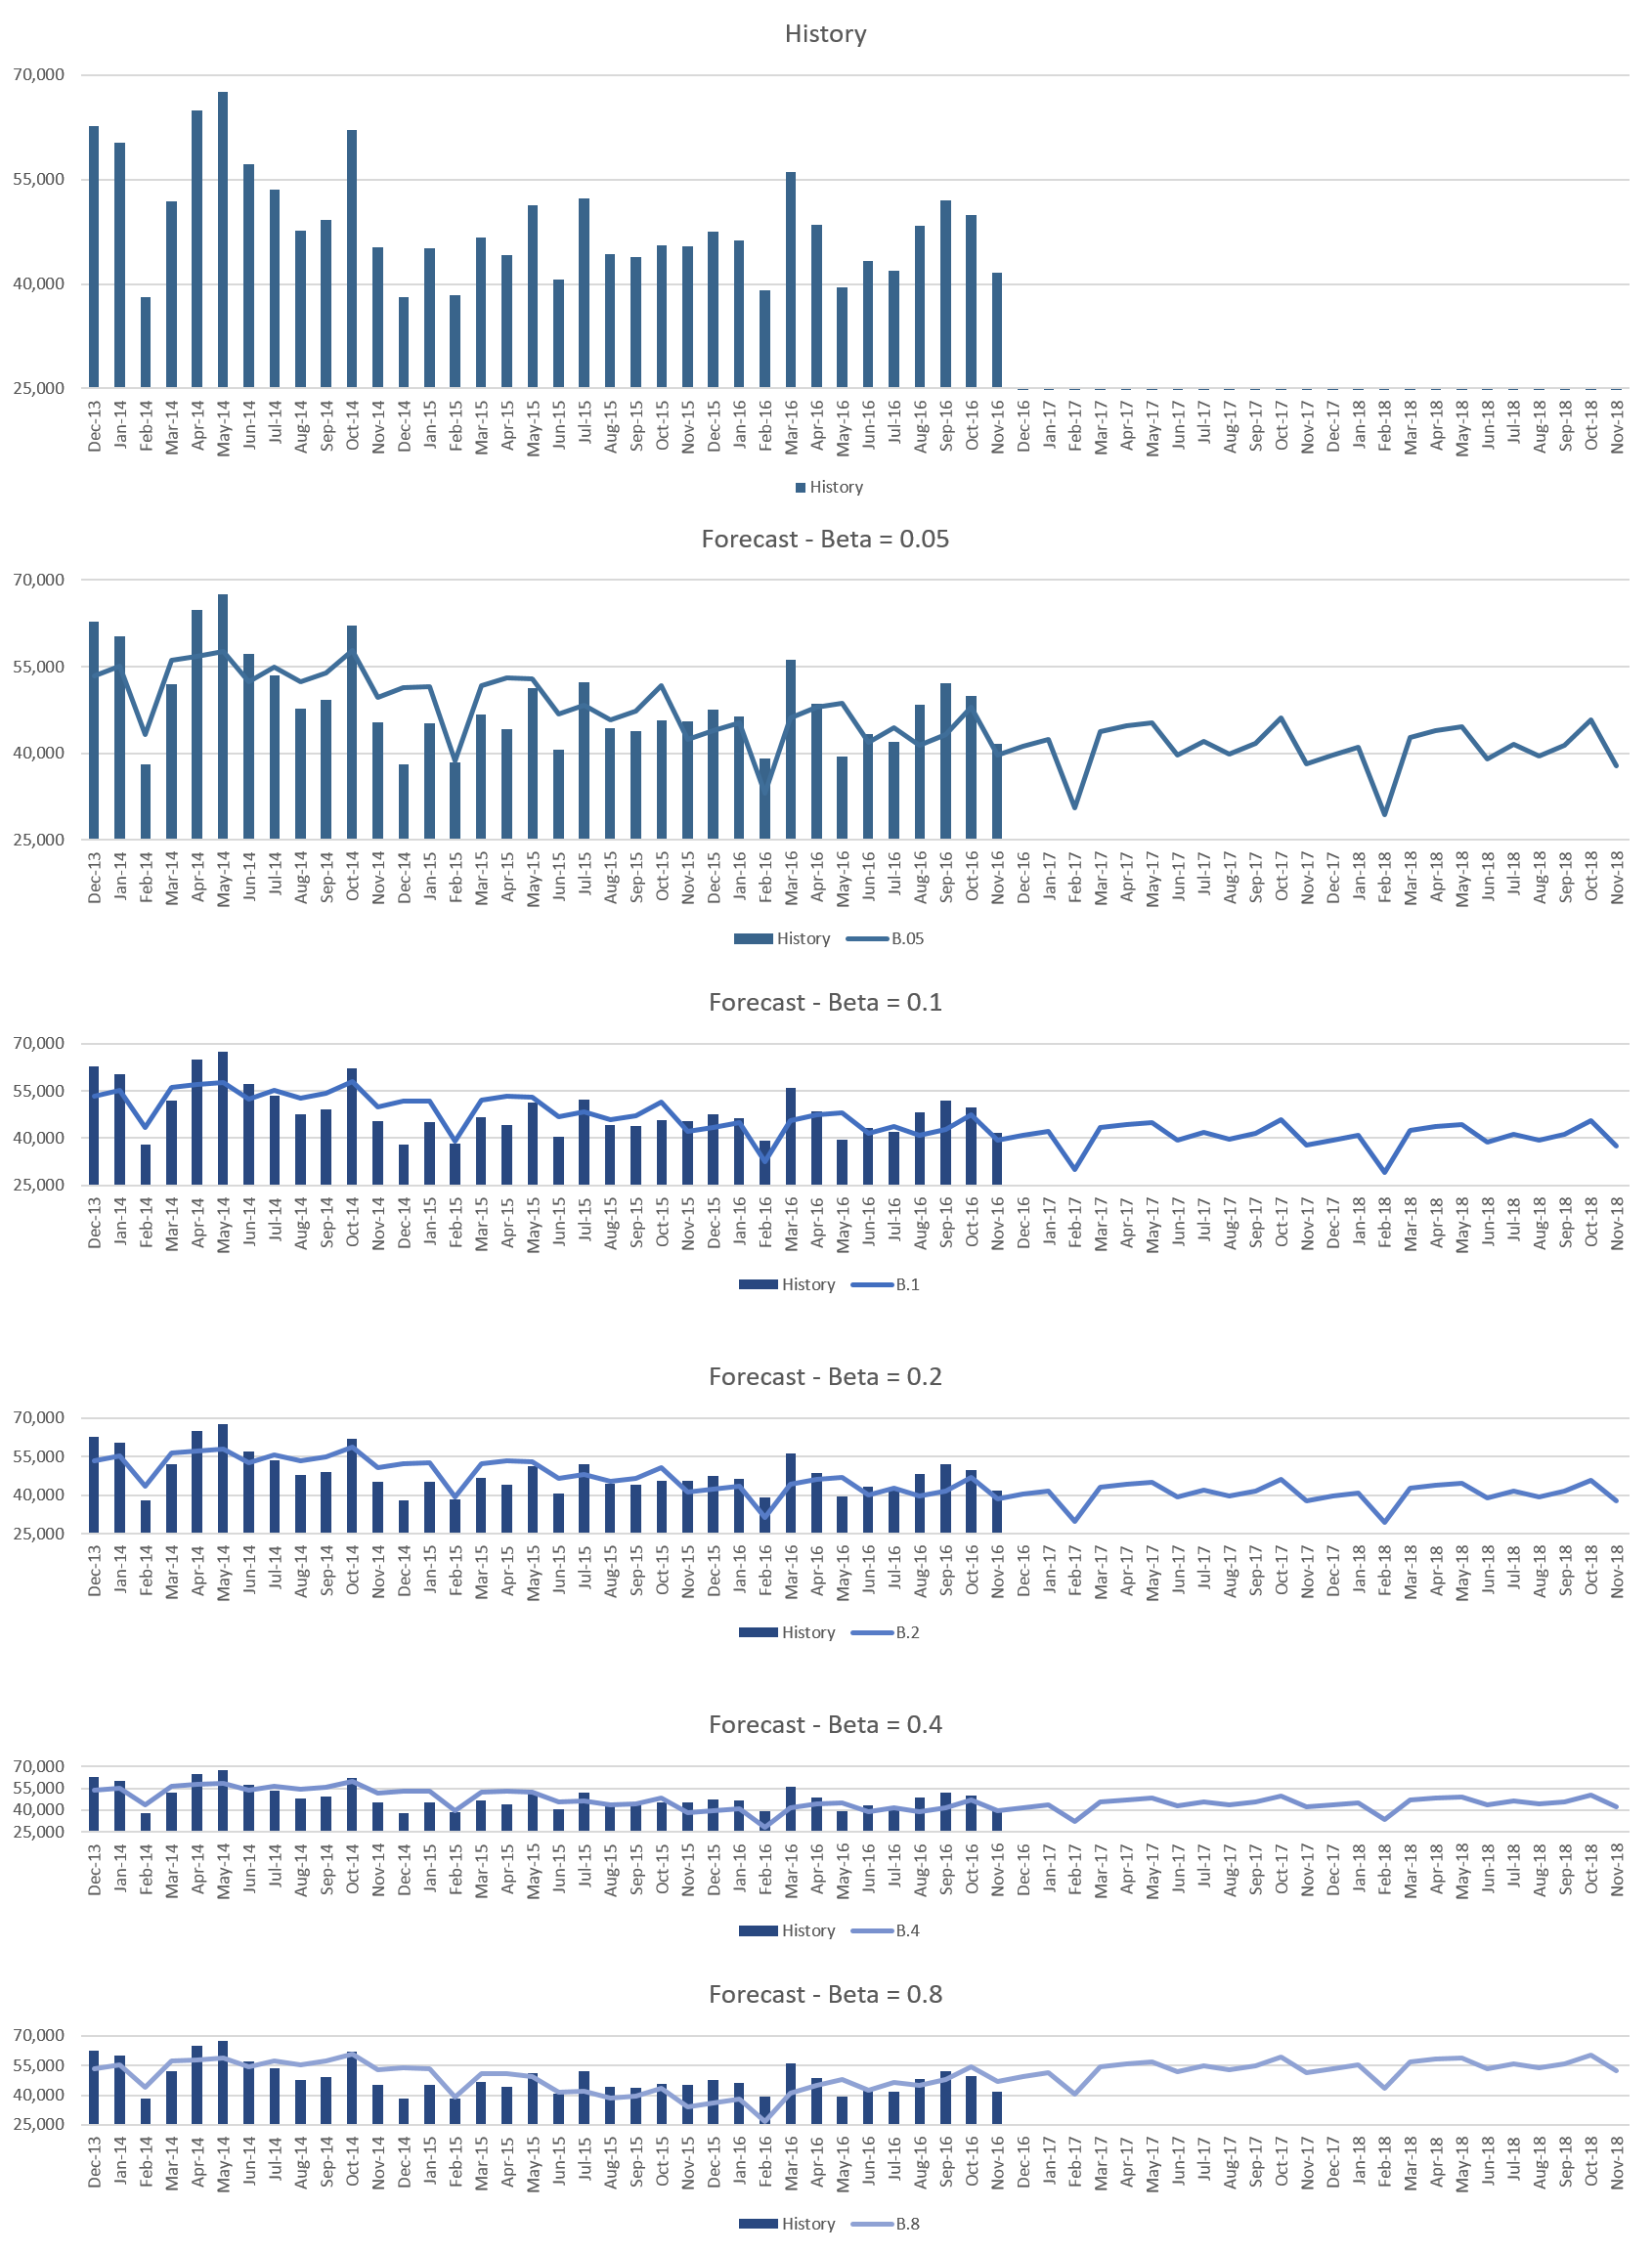
We observe that as the Beta value changes from 0.05 to 0.1 to 0.2 there is minimal impact on the forecast. The trend continues to follow a general downward trend that exists from the last 3 years. But as we make the parameter large and put more weightage on the recent trend – 40 and 80 percent – we see the forecast picking up based on the trend from the last 5-6 months.
One can argue that when Beta is very high at 80%, the forecast should show a downward trend since the last months’ (Nov’16) actuals are less as compared to the previous month (Oct’16). But from the above charts, we see that it takes more than just 2 months to impact the trend, even when the parameter is set to be as high as 80%. Moreover, low values for November compared to October have as much to do with seasonality as they to do with the trend.
What-if Scenario Forecast Numbers
| Month | History | Month | ForecastB.05 | ForecastB.1 | ForecastB.2 | ForecastB.4 | ForecastB.8 | |
| Dec-13 | 62,719 | Dec-16 | 41,264 | 40,857 | 40,362 | 41,840 | 49,359 | |
| Jan-14 | 60,312 | Jan-17 | 42,447 | 42,060 | 41,681 | 43,643 | 51,561 | |
| Feb-14 | 38,119 | Feb-17 | 30,517 | 30,147 | 29,868 | 32,239 | 40,489 | |
| Mar-14 | 51,926 | Mar-17 | 43,688 | 43,332 | 43,138 | 45,854 | 54,375 | |
| Apr-14 | 64,856 | Apr-17 | 44,740 | 44,397 | 44,274 | 47,281 | 56,022 | |
| May-14 | 67,589 | May-17 | 45,212 | 44,880 | 44,817 | 48,069 | 56,990 | |
| Jun-14 | 57,151 | Jun-17 | 39,641 | 39,318 | 39,308 | 42,766 | 51,834 | |
| Jul-14 | 53,502 | Jul-17 | 42,116 | 41,802 | 41,835 | 45,465 | 54,654 | |
| Aug-14 | 47,696 | Aug-17 | 39,933 | 39,625 | 39,695 | 43,469 | 52,757 | |
| Sep-14 | 49,189 | Sep-17 | 41,787 | 41,485 | 41,586 | 45,478 | 54,848 | |
| Oct-14 | 62,103 | Oct-17 | 46,167 | 45,870 | 45,996 | 49,984 | 59,422 | |
| Nov-14 | 45,289 | Nov-17 | 38,071 | 37,778 | 37,925 | 41,992 | 51,490 | |
| Dec-14 | 38,105 | Dec-17 | 39,674 | 39,366 | 39,505 | 43,707 | 53,616 | |
| Jan-15 | 45,149 | Jan-18 | 41,095 | 40,791 | 40,953 | 45,229 | 55,180 | |
| Feb-15 | 38,361 | Feb-18 | 29,368 | 29,069 | 29,249 | 33,588 | 43,565 | |
| Mar-15 | 46,655 | Mar-18 | 42,711 | 42,416 | 42,611 | 47,001 | 56,990 | |
| Apr-15 | 44,090 | Apr-18 | 43,910 | 43,618 | 43,827 | 48,256 | 58,244 | |
| May-15 | 51,350 | May-18 | 44,506 | 44,218 | 44,437 | 48,898 | 58,879 | |
| Jun-15 | 40,574 | Jun-18 | 39,041 | 38,755 | 38,984 | 43,470 | 53,440 | |
| Jul-15 | 52,236 | Jul-18 | 41,606 | 41,323 | 41,560 | 46,064 | 56,019 | |
| Aug-15 | 44,306 | Aug-18 | 39,499 | 39,219 | 39,462 | 43,978 | 53,917 | |
| Sep-15 | 43,866 | Sep-18 | 41,419 | 41,140 | 41,388 | 45,910 | 55,834 | |
| Oct-15 | 45,607 | Oct-18 | 45,854 | 45,576 | 45,827 | 50,352 | 60,260 | |
| Nov-15 | 45,457 | Nov-18 | 37,805 | 37,529 | 37,781 | 42,305 | 52,203 | |
| Dec-15 | 47,582 | |||||||
| Jan-16 | 46,313 | |||||||
| Feb-16 | 39,110 | |||||||
| Mar-16 | 56,107 | |||||||
| Apr-16 | 48,553 | |||||||
| May-16 | 39,483 | |||||||
| Jun-16 | 43,245 | |||||||
| Jul-16 | 41,954 | |||||||
| Aug-16 | 48,323 | |||||||
| Sep-16 | 52,052 | |||||||
| Oct-16 | 49,837 | |||||||
| Nov-16 | 41,619 |
So, if there is a business case where a company has introduced a couple of new products and is seeing a growth in sales in the last 6 months, they can consider increasing the trend parameter so that the forecast follows the increasing trend.
In the next post, we will analyze how the seasonal parameter, Gamma, impacts the forecast.