
Quality analysis can be a tedious task for operations and plant managers, especially when you are working across several shifts, across multiple factory locations.
According to a recent research:
- 3.14 hours are spent creating the work schedule a week.
- 20% of an operations manager’s time is spent manually creating the work schedule.
- 174% more turnover occurs due to errors from manual schedule creation.
- 140 hours are wasted annually by creating a manual work schedule.
This all impacts quality!
Quality Problems on the shop floor can be a pressing reason contributing to increased operating costs, reduced operations revenue, high worker turnover, and most importantly rising worker grievances.
It is not a surprise that most operations managers spend a major chunk of their productive hours in shift scheduling, shift analysis, and trying to understand the defect and yield rates as an initial ‘litmus” test for quality.
- What if you had real-time accurate shift data, sliced by shift, shift hour, day of the week, etc. at your fingertips?
- What if you could access automated shift analysis reports that can be used in your weekly team huddles, doing away with the manual grunt work?
- What if you could easily prioritize shift focus and resource allocation to accelerate operational output gains?
ThroughPut’s Analytics-enabled Operational Excellence Product ELITE gives you the power to work with your existing plant’s operational shift data to create highly effective outcomes, eliminating inefficiencies at the core.
All you need to do is plug in your existing defect data and ELITE runs a powerful Analytics-driven analysis giving you the most detailed shift analysis for your factory operations.
5 reports that slice and dice your existing defect data to see the holistic picture and work towards better output, productivity, and profitability.
Report 1: Average Shift Performance – Analyzing the Average Shift Defect Rate Over Some Time (Week, Month, Quarter) to Highlight Areas that Need Attention.
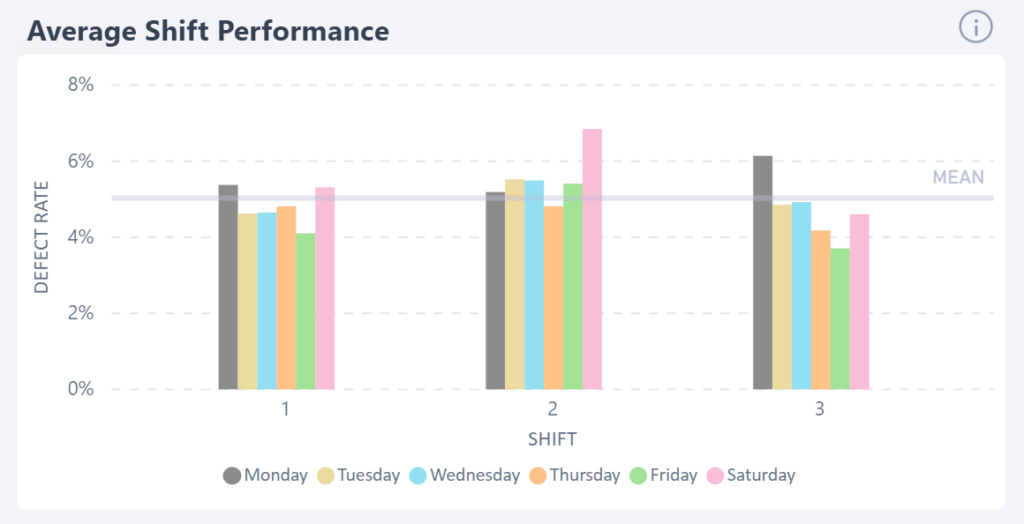
This report helps benchmark the average defect for all work shifts during the average week. By identifying that week’s average defect rate for a particular shift, it indicates the level of % defect that needs immediate attention to the manager.
Using this report, managers can prioritize which shift needs priority on which days of the week depending on those contributing to higher defect %.
Access- Available on the Free Trial Version
Report 2: Shift Performance – Analysing the Rate of Change in Defect Rate Behavior Per-hour Across Shifts
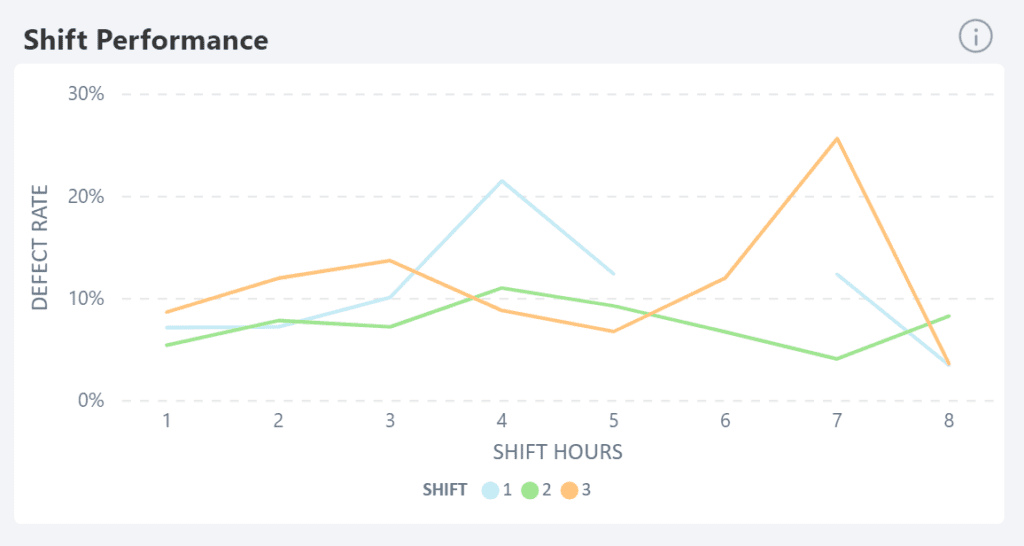
The shift performance report helps managers track the exact rate of change of the shift defect rate behavior per hour across all shifts. The peak defect rate hours highlighted here are those that need additional investigation and resources to improve quality of shift performance
Using this report, managers can evaluate the overall shift performance on an hourly basis to eliminate challenges in peak defect rates where necessary.
Access- Available on the Free Trial Version
Report 3: Root Cause Analysis – Analysing by Predicting Potential Root Causes for Quality Concerns.
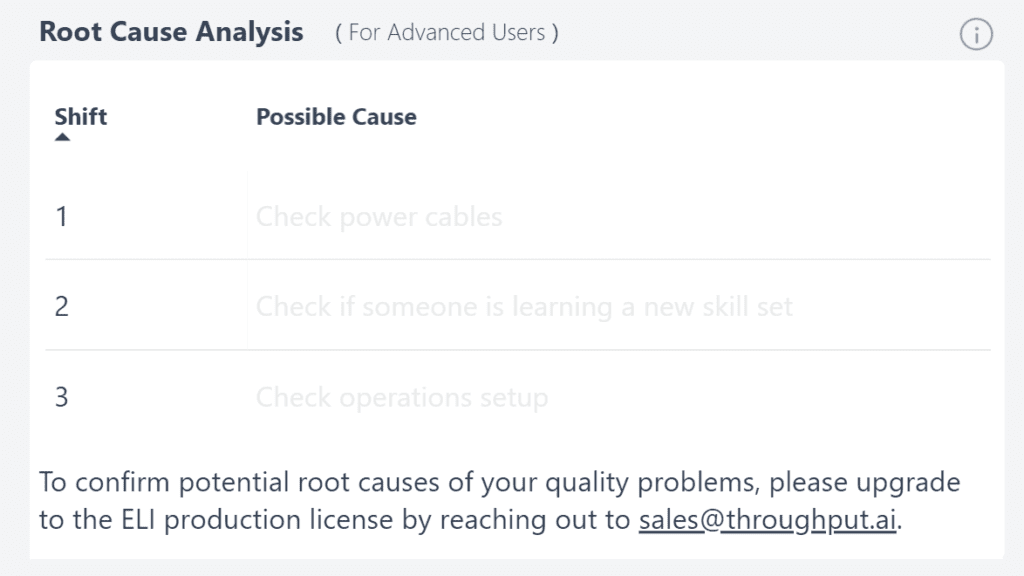
This report helps managers predict what the initial reasons for existing quality concerns and problems might be, across each shift.
Using this report managers can easily pin-point the reasons behind quality problems across various shifts
Access- Available on the Enterprise Version ELI
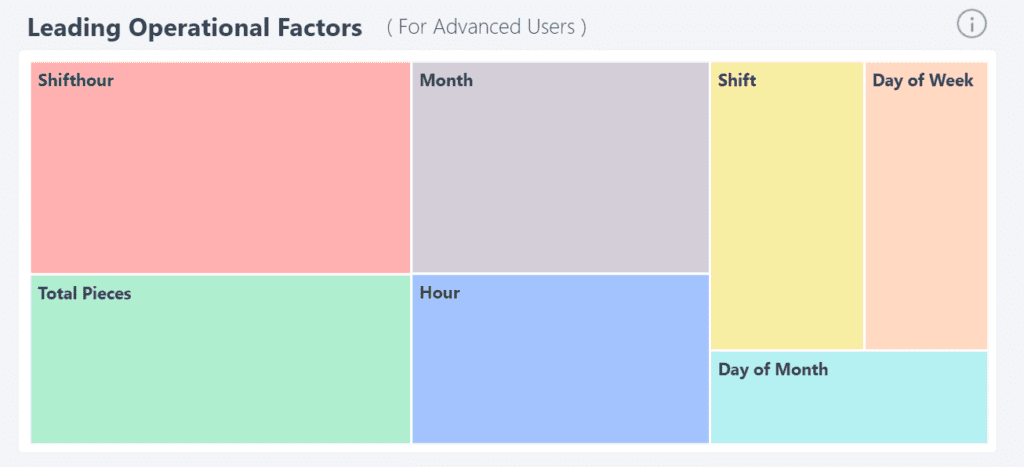
Report 4: Leading Operational Factors: Analysis to Determine the Bottlenecks for Potential Root Cause Accuracy.
The Leading Operational Factors report lists the variables ELI is factoring in and weighing to determine bottlenecks and potential root cause accuracy. The function runs a simultaneous multivariate derivative and correlation analysis to ensure the best quality improvement recommendations.
The current rubric for operational recommendations is depicted in this tree map.
Using this report, managers can pinpoint the top operational factors which can result in potential bottlenecks and track their root cause accuracy.
Access- Available on the Enterprise Version ELI
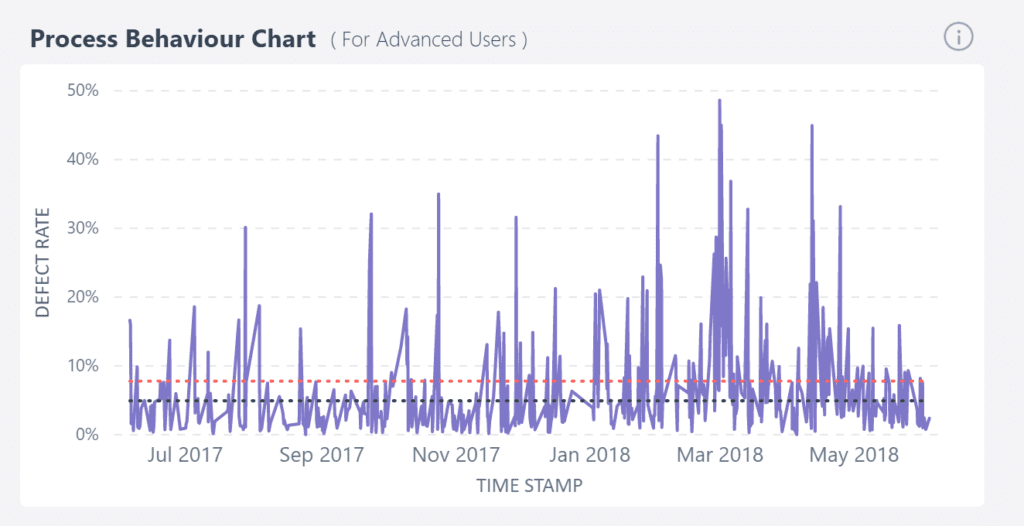
Report 5: Process Behaviour Chart: Analysis of Defect Rate Using Statistical Methodologies.
The Process Behaviour Chart allows operations managers to inspect defect rate from a statistical perspective and benchmark this against operational resolutions and best practices developed by thought leaders and internal references.
Using this report, managers can easily monitor the stability and consistency of any process.
Access- Available on the Enterprise Version ELI
Start using these reports to get an accurate status of the Quality of your Operations. Activate your free trial today and witness transformational results for your factory operations.