Constraints on trucks and drivers continue to keep spot market truckload rates high, even as demand cools from where we were a few weeks ago.
The latest September Cass report based on data from shippers freight invoices reported that shipment volumes were only 1.8% below year-ago levels in September, which was a 7% m/m improvement from August – when volumes were down 7.6% y/y. As both contract and spot rates rise, so has the Cass cost per shipment index (measures the total amount spent on freight), which is now up 1.2% y/y.
Tune into DAT iQ Live, live on YouTube or LinkedIn, 10am ET every Tuesday.
Cass noted, “there are real constraints on driver and industry supply and fewer trucks running, so as freight has rebounded, the capacity squeeze has driven rates up significantly. We don’t see much capacity entering or returning the rest of the year, so as supply/demand remains tight, we expect continued growth in the average freight bill”.
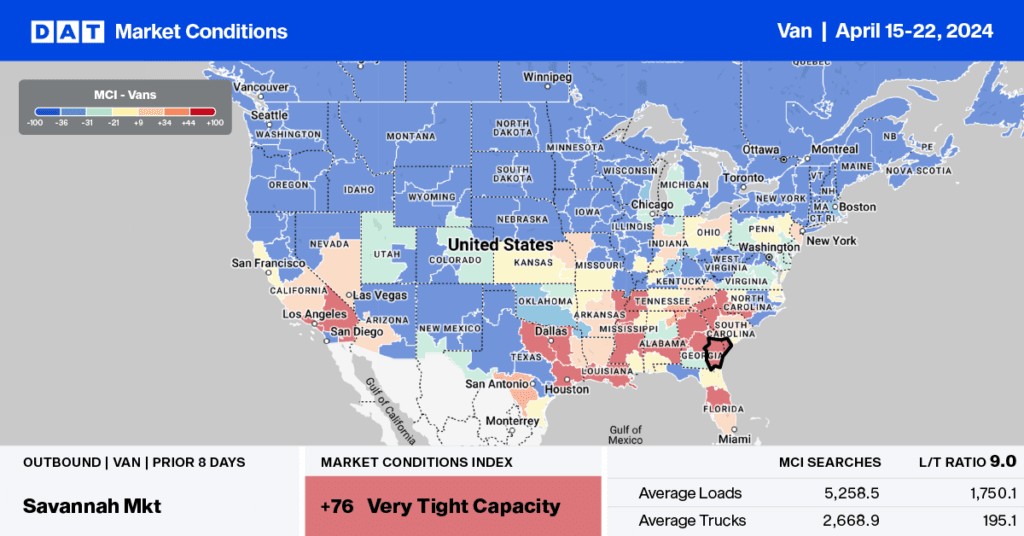
Van trends
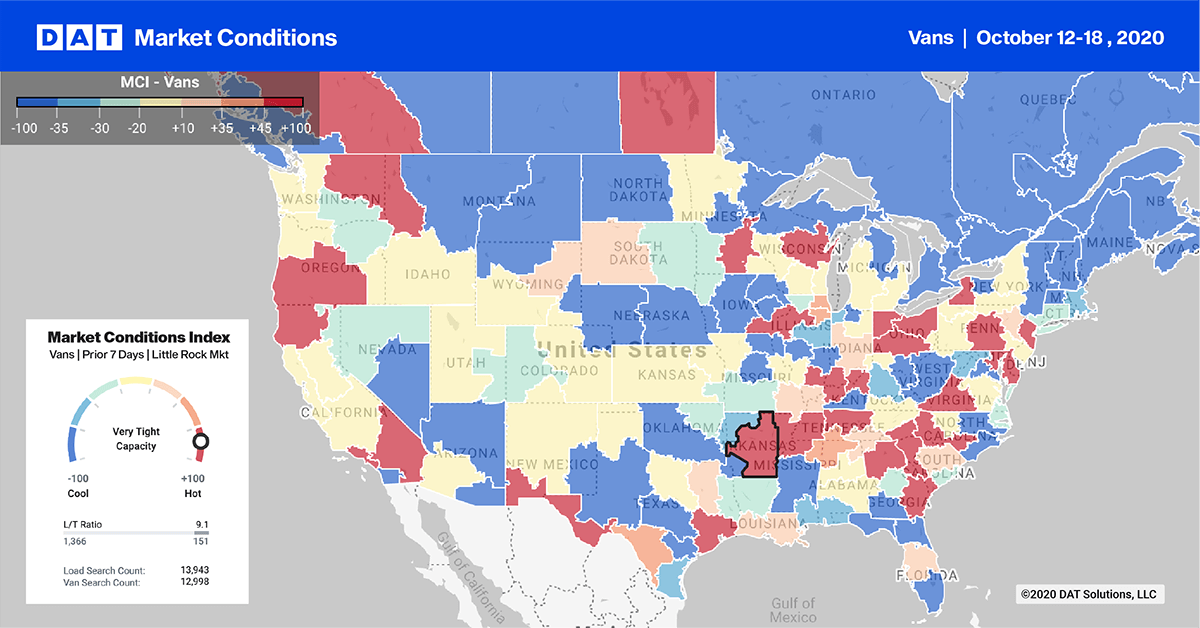
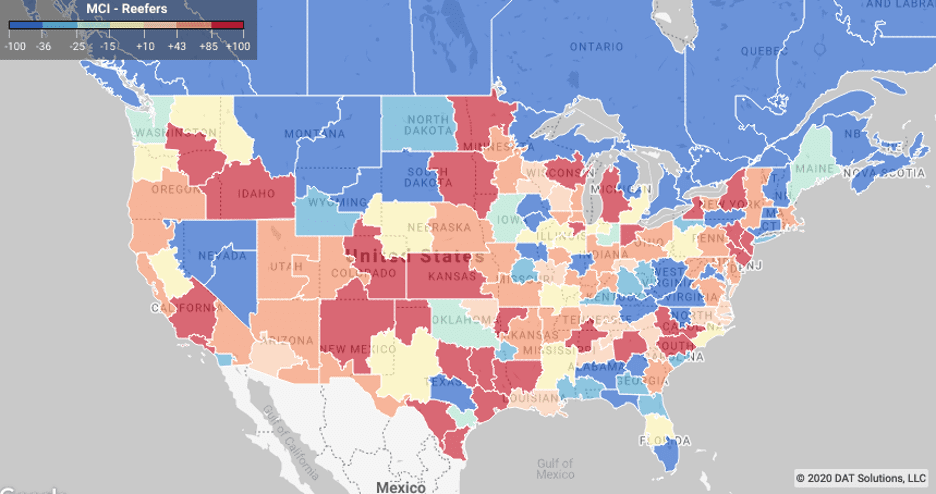
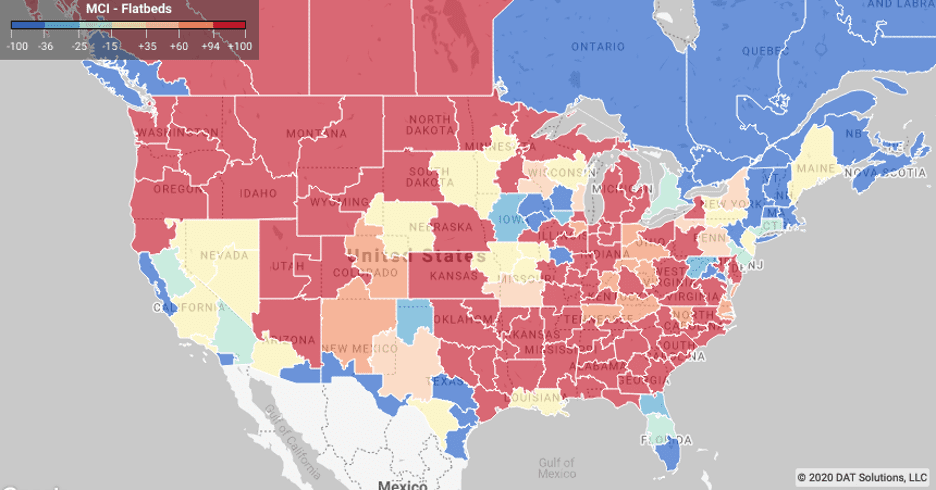
> Learn more about the Market Conditions Index
In our top 10 freight markets, load post volume decreased by 5%, with the most noticeable volume decrease recorded in Memphis (ranked #2 last week), where volume dropped by 14% w/w. Capacity is still tight though with outbound Memphis, so spot rates up 2 cents to $2.59/mile (minus fuel). Atlanta had the highest volume of load posts last week but also was also down 6% w/w. On the West Coast in Los Angeles (#5) and Ontario (#6) markets, load post volumes dropped by 4% w/w but capacity remains tight.
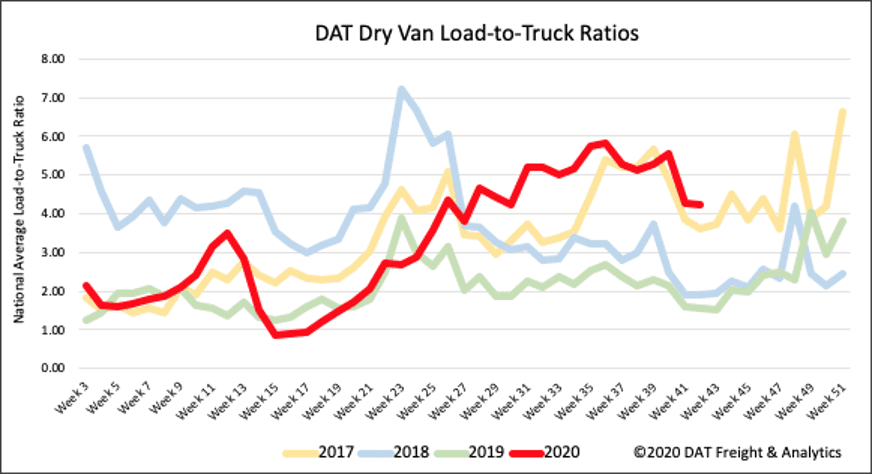
The dry van load-to-truck ratio (LTR) decreased by just under one percent last week from 4.26 to 4.23. Dry van load postings dropped by close to 4% and remain 136% higher y/y. Unlike in the reefer and flatbed sectors, where truck posts increased, truck posts decreased by 3%, which is most likely a reflection of extra volume due to e-commerce and big-box retailers conducting online shopping events six weeks earlier than normal.
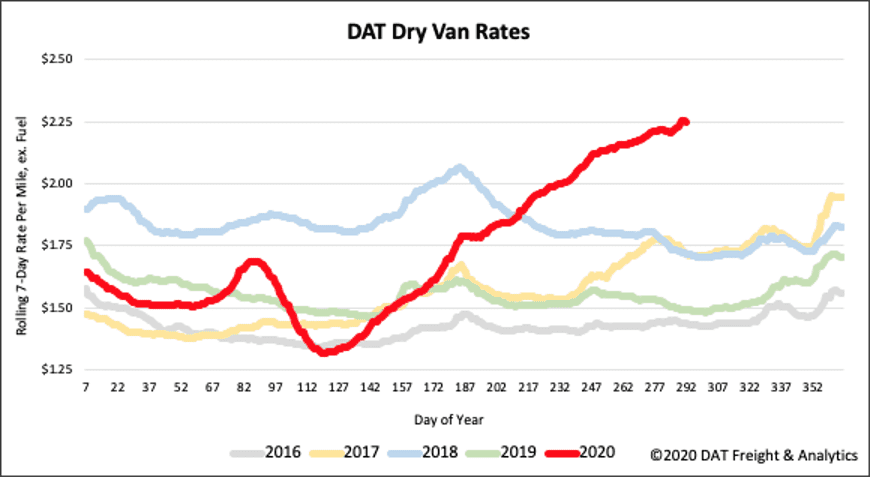
As expected, spot market rates remained relatively flat last week, plateauing at the $2.25/mile mark excluding FSC. This is still the highest dry van spot rate we’ve seen in the last five years, with rates up 51% y/y. Since the low-point in spot rates on May 1, rates have increased $0.93/mile making this the longest rate rally we’ve seen in many years. Compared to the same week in 2019, rates were up 51%.
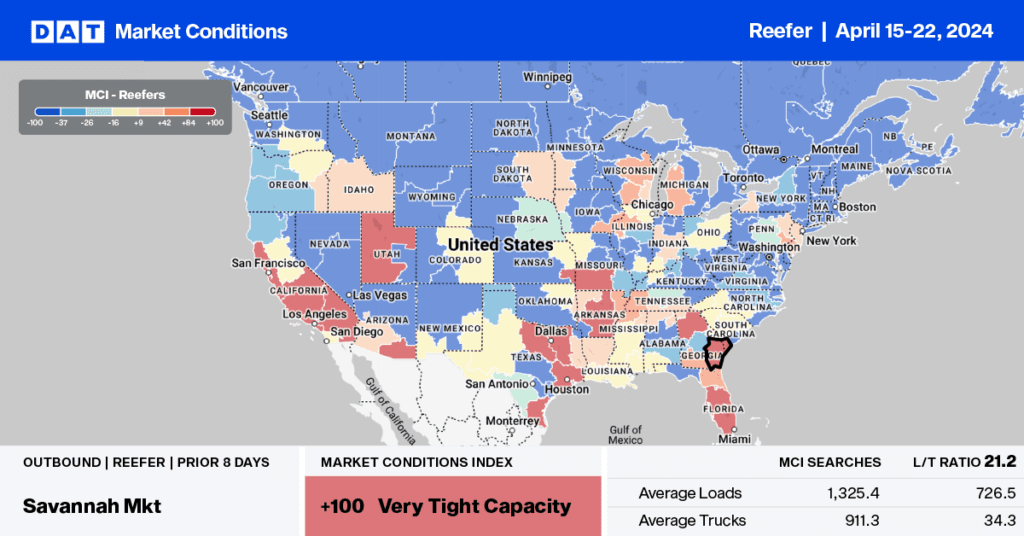
Reefer trends
With just over four weeks to go until Thanksgiving we’re starting to see higher volumes of refrigerated freight out of poultry-producing markets, especially in North Carolina and Minnesota, which rank nos. 1 and 2 for turkey production.
The United States is the world’s largest turkey producer with around 245 million birds raised yearly, equating to 6.6 billion pounds or the equivalent of 152,800 truckloads. The U.S. is also the largest exporter of turkey products, and according to the USDA, 63% of turkey production comes from just five states: North Carolina (17%), Minnesota (16%), Indiana (12%), Missouri (9%) and Arkansas (9%).
Demand for fresh turkeys increases significantly over the next four weeks in the lead-up to Thanksgiving placing considerable pressure on freight markets where reefer capacity is already tight.
In our top 10 refrigerated markets, load posts were down 3% last week. Atlanta recorded the most load posts, although volumes were still down 10% w/w, putting downward pressure on spot rates. Elizabet, NJ (ranked no. 2 last week) recorded another decrease of 18% w/w, with rates staying flat. The largest volume decrease was in Chicago, which dropped 22% w/w. In contrast, the Charlotte, NC, market recorded a 24% w/w.
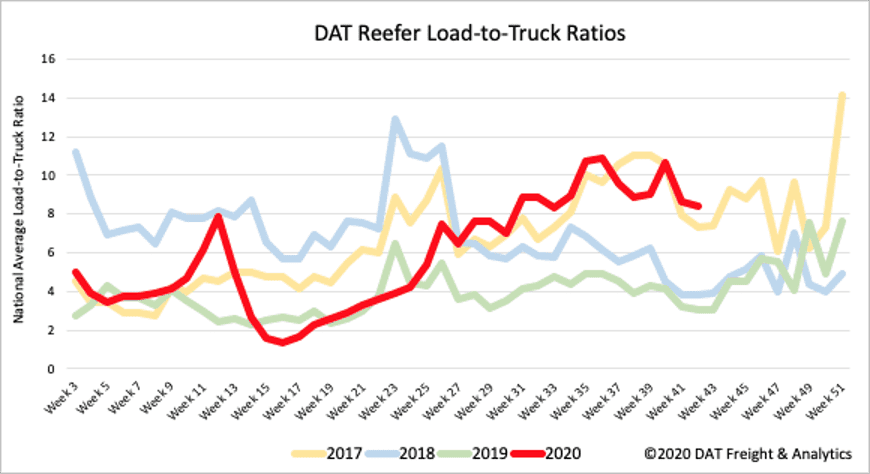
Last week’s reefer LTR dropped by 3%, from 8.65 to 8.41, following a 3% drop in load posts. In contrast to dry vans, reefer truck posts increased slightly last week and remain up 149% y/y. Compared to the same week in 2019, there were also 10% fewer truck posts, which is a reflection of the overall capacity tightness the market is experiencing.
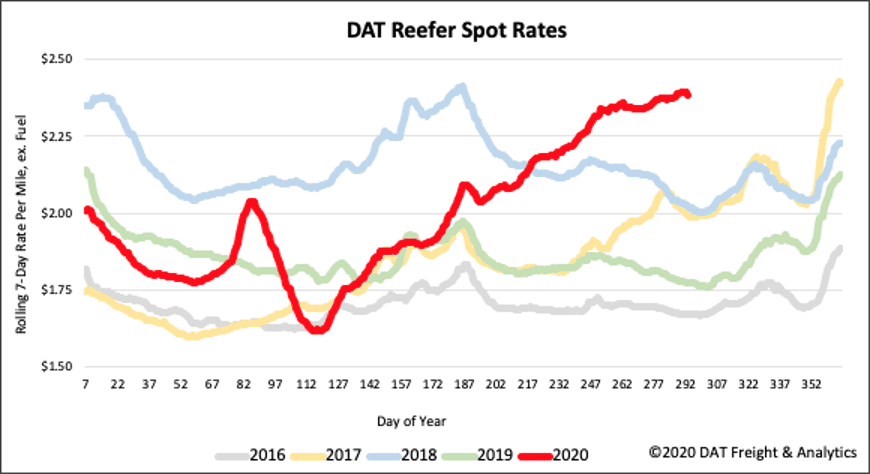
There is a definite plateauing of rates in the reefer sector with rates sticking around the $2.38/mile mark last week. Reefer spot rates have been in a tight $0.04/mile band for the last four weeks and similar to dry van, rates are up 76 cents since the April 22 low point. Compared to the same week in 2019, reefer rates were up 34%.
Flatbed trends
Some recent data points to ongoing demand in the housing and construction sectors this week, following the sharp decline in spring – good news for flatbed carriers hauling lumber and building materials and dry van carriers hauling home furnishings.
The National Association of Home Builders (NAHB)/Wells Fargo Housing Market Index, a monthly survey to gauge builder sentiment in the single-family housing market, continued to improve in October, setting a record high. According to NAHB Chairman Chuck Fowe, “buyer traffic remains high and record-low interest rates are keeping demand strong as the concept of ‘home’ has taken on renewed importance for work, study and other purposes in the Covid era”.
This week’s U.S. Census Bureau September report on new home construction was also good news for carriers in this sector. Single family housing starts were up 8.5% m/m with 56% of the new dwellings slated for the southeast region.
For carriers in the industrial manufacturing sector, the news isn’t as good following a 0.6 % drop in industrial production in September, its first decline after four consecutive months of gains.
Outbound load posts dropped by 6% w/w in our top 10 flatbed markets, with the most noticeable volume decrease in Memphis, which fell 30% w/w. Available capacity is still tight, though, which pushed rates higher.
In contrast, volumes in the neighboring Little Rock market increased by 13% w/w, with spot rates also shifting up by $0.08/mile to $2.77/mile. In the Medford, OR, load posts increased by 12% w/w, driving up spot rates by 16 cents to $2.75/mile.
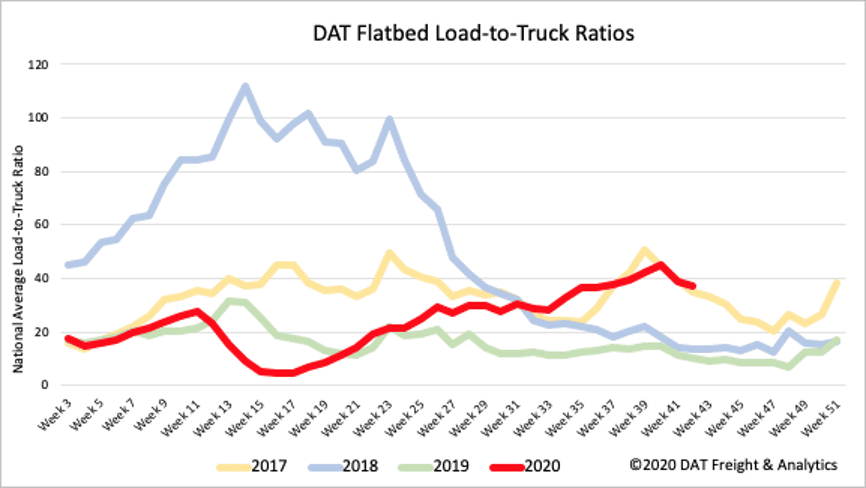
The flatbed LTR decreased by 5% last week from 39.07 to 37.15 following a 2% drop on load posts and 3% increase in trucks posts. Compared to the same week in 2019, there are 32% fewer trucks posting for loads, with 2017 still the best guide for seasonal LTR trends.
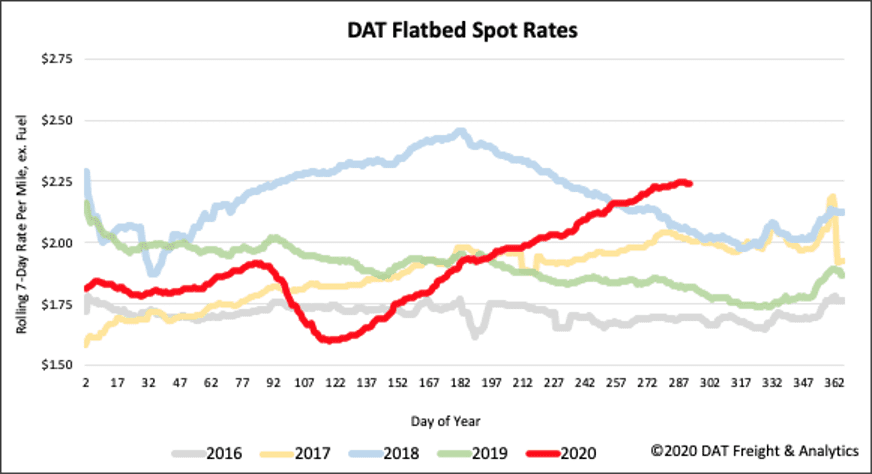
Flatbed spot rates continued to plateau, ending the week where they started at $2.24/mile excluding FSC. Since the low-point on flatbed rates on April 28, flatbed spot rates have risen 54 cents and remain up $0.42/mile or 23% higher y/y.