Freight brokers moved 21% more loads in March, compared to the same month last year, setting a two-year record for load volume, according to the latest Broker Benchmark Report published by DAT. Average revenue per load was 35% higher, year over year, yielding a 63% increase in total revenues for the group, compared to March 2017.
Gross margins averaged 12.6% in March. That represented an increase from lackluster performance in February and January, but did not match the 14.3% average of March 2017. Margins were squeezed due to continued, robust levels of demand and tight capacity, which kept truckload rates high.
Operating profit per employee continued to rise in March, due to the improved gross margins and good cost control. Both labor and non-labor expenses declined as a percentage of net revenue, partially offsetting the impact of margin compression.
Q1 2018 Brings 30% Growth – For the first quarter, both load counts and revenue per load rose 30%, and net operating profit per load rocketed up from an anemic $4.34 per load in Q1 2017 to $16.10 in the most recent quarter.
This benchmark report draws data from an aggregate of more than 100 freight brokerage companies, whose 2017 average annual revenue of $19.5 million grew 26% compared to 2016.
To receive monthly updates in your inbox, subscribe to the DAT Broker Benchmark Report.
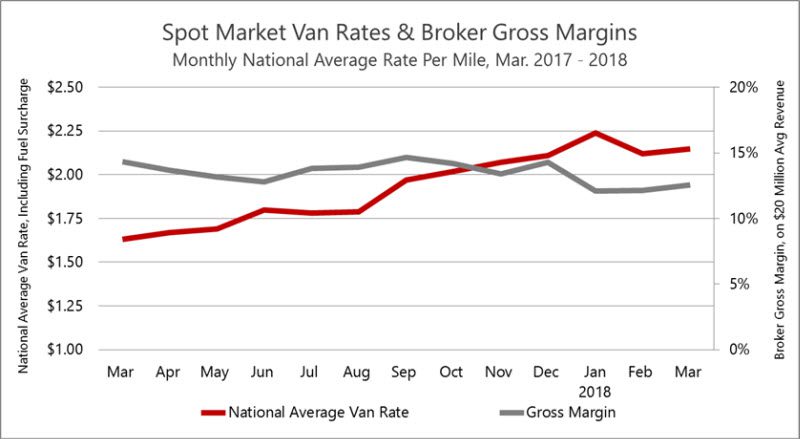
Gross margin edged up to 12.6%, which was an improvement over February’s low 11.9%, but disappointing compared to 14.3% gross margins of March 2017. Margins were compressed due to high rates on purchased transportation. For example, van spot rates rose 1.4% month over month in March, to a national average of $2.15 per mile, which is 32% above last year’s levels.
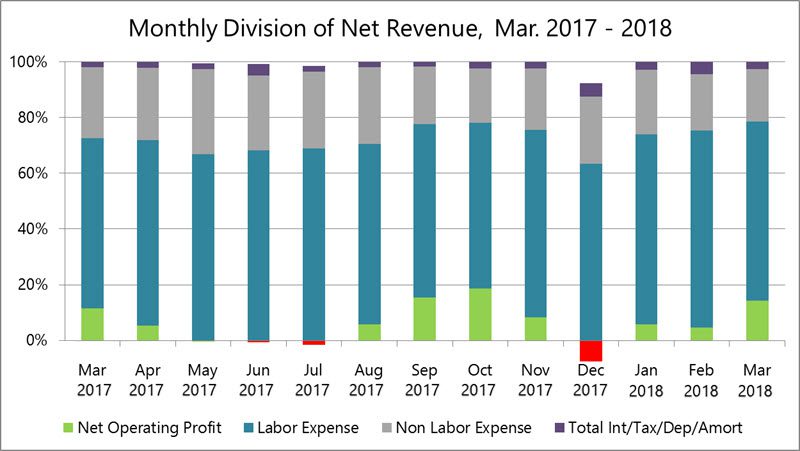
Brokers continued to cut costs in March, which helped to offset the impact of low gross margins on net operating profits. Although labor costs increased 51% compared to March 2017, labor expenses dropped to 64% as a portion of net revenue, the lowest level since October. Non-labor operational costs rose 5% compared to March 2017, coming in under 20% of net revenue for the first time in two years.
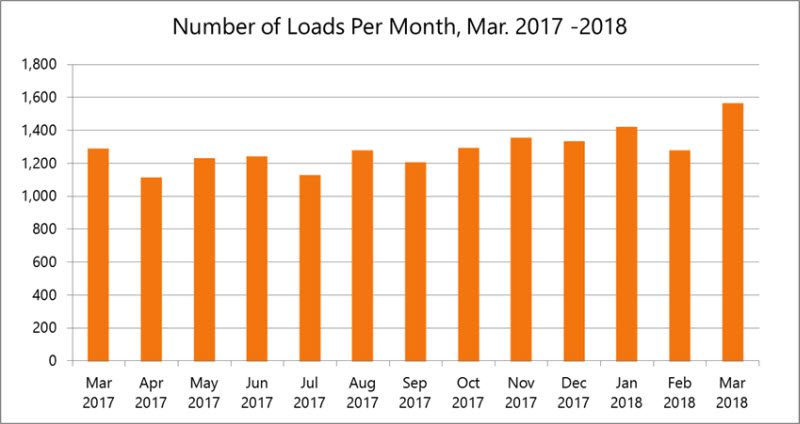
Brokers moved 21% more loads in March, compared to the same month in 2017, hitting a two-year high. Load counts rose 22% compared to February, in a typical pattern for the season.
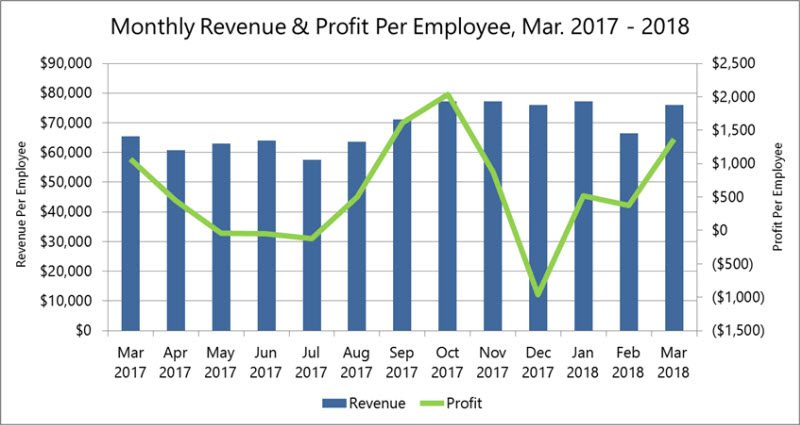
Profit per employee rose 28% year over year to the highest point since October, despite a 38% increase in the number of employees. Revenue per employee increased 16% compared to March 2017.
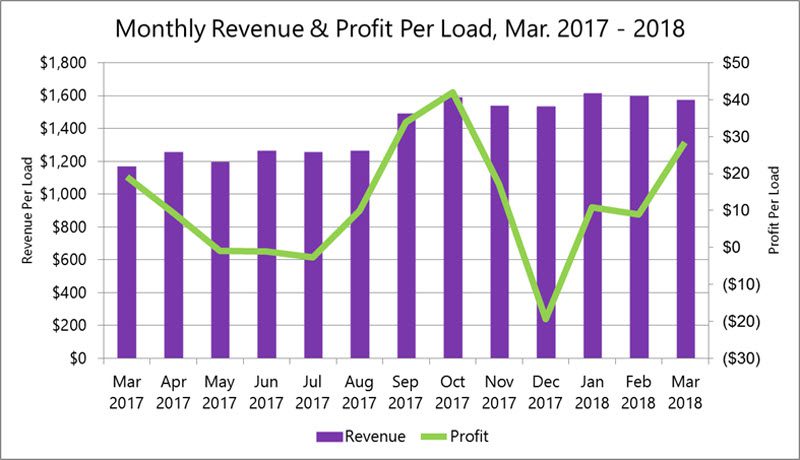
Average revenue per load was 35% higher, year over year, yielding a 63% increase in total revenues, compared to March 2017.
Subscribe to the DAT Broker Benchmark report, and have it delivered to your inbox each month.