
How to calculate safety stock: three different calculations
 Peter Drakeley
Determining appropriate levels of stock across a business can be very challenging. If you carry too much inventory, you risk tying-up much needed working capital. But if you don’t carry enough, you face stock-outs and reduced service levels. An important piece of this puzzle is to accurately calculate safety stock levels.
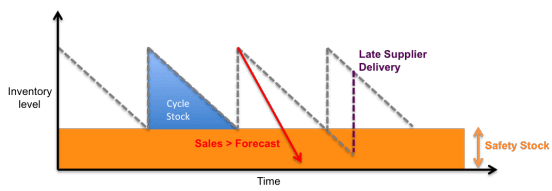
Safety stock is defined as inventory that is carried to prevent stock-outs caused by fluctuating customer demand, forecast inaccuracies or variability in supplier lead times. Safety stock is intended to cover any shortfall in cycle stock during the lead time period. Safety stock is a key element of the reorder point formula:
![]()
The purpose of safety stock is to minimize disruption to order fulfilment while investing the lowest possible amount of capital in inventory.
When demand for inventory items is consistent and lead times are reliable, it’s fairly easy to determine safety stock levels that will achieve this. But, when demand and supply fluctuate, many inventory planners find it much tougher to calculate safety stock accurately. All too often they chose to use simple safety stock formulas, which are insufficient to deal with the supply and demand challenges they face.
Three simple ways to calculate safety stock
Calculating safety stock can be as simple or complex as you make it. Here are three simple safety stock calculations with some advantages and drawbacks for each one.
1. Fixed safety stock levels
Many companies set a fixed level of safety stock for their inventory items – that is, they add a ‘best-guess’ quantity to the reorder point to allow for any issues.
This number is often set at item group level and based on the judgment or assumptions of the inventory management team – there are no formal calculations used.
Let’s introduce Mary’s Plumbing Warehouse as an example. Mary has reviewed her previous month’s sales and used these figures to set her forecast for the next four weeks:
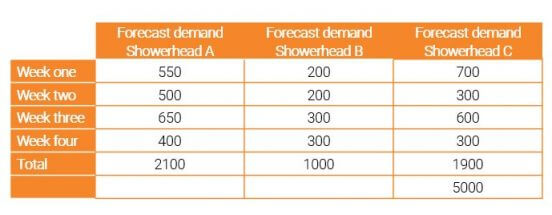
She could now simply decide to carry one week’s worth of safety stock for each SKU, using last month’s highest week of sales as her safety stock figure e.g. 650, 300 and 700 respectively.
This basic approach is easy to set-up and manage, but often leads to stock imbalances. For example, Mary may end up with unnecessarily large amounts of capital invested in excess stock of Showerhead C, whereas she could easily run out of Showerhead B.
2. Time-based safety stock calculations
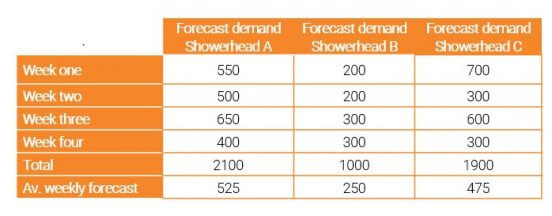
A time-based safety stock calculation finds the average sales over a fixed period of time and uses this value as the safety stock level.
For example, if Mary uses her average weekly forecasts (based on last month’s sales) to calculate safety stock, she would end up with 525 units of safety stock of Showerhead A, 250 extra units of Showerhead B and 475 of Showerhead C.
However, just like using the fixed safety stock method, time-based calculations can also often lead to over- and under-stocking. One reason for this is because both approaches assume that the forecasted demand will be accurate and that lead times will remain consistent. In reality, of course, this rarely happens.
For starters calculating demand based on historical sales alone often leads to inaccurate forecasts – read more here. This is because each SKU in your inventory has a unique demand pattern: some will have steady demand, others will be more lumpy or erratic. Forecasts based on historical consumption alone cannot account for this.
At the same time, lead times can be inconsistent due to a range of issues, such as production downtime or delivery delays.
By definition, a ‘one size fits all’ approach to calculating safety stock will deliver the right amount of inventory for some items, but too much or too little for others. As a result, managers get inventory imbalances that can lead to excessive inventory costs and/or inconsistent service levels.
This can be seen if we look at each SKU in turn.
Mary’s forecasts show that demand for Showerhead C could be much more erratic than A or B, but still decides to use her average weekly demand as her safety stock quantity.
As we can see from the actual sales figures:
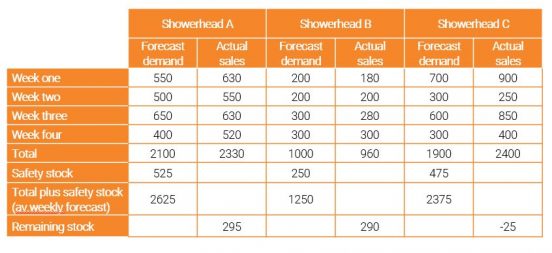
Showerhead A sees actual sales that are higher than the forecast, but the safety stock does its job by providing enough stock to cover the rise in demand with 295 units of safety stock remaining.
Showerhead B sees actual sales slightly below forecast, so a surplus of 290 units are remaining, made up of 250 units of safety stock but also 40 units of excess stock, tying-up much needed capital.
Showerhead C sees actual sales that are higher than the predicted forecast, but the safety stock fails to cover the actual demand in week four, falling short by 25 units. This leads to a stock-out in week four and a number of expensive back orders.
For products whose demand is more erratic, higher levels of safety stock are required, but how do you calculate the optimal level?
3. Average/Max safety stock formula
A more prudent calculation is to use an average/max safety stock formula, which accounts for when lead times rise and sales max out.
Mary’s average lead time is one week but it can be as high as 1.5 weeks. Using this information and her sales data from last month, she can work out safety stock for each showerhead SKU:
![]()
Shower head A: (630 x 1.5) – (582.50 x 1) = 362.50 units
Shower head B (300 x 1.5) – (240 x 1) = 210 units
Shower head C (900 x 1.5) – (600 x 1) = 750 units
Problems arise with this formula if the maximum lead time and sales are considerably higher than the average, which results in the levels of safety stock being significantly inflated.
Statistical safety stock calculations
Statistical safety stock formulas overcome many of the drawbacks of the three methods above. Instead of using historic consumption or sales data to calculate the forecast, they use probability distributions to model demand and account for variance. A probabilistic approach to calculating safety stock accepts that there is uncertainty when predicting future events, such as demand volume and frequency, and accommodates for this by covering for a percentage of all possible inventory requirements.
While the safety stock calculations become more complicated, they are also much more accurate as they take into account target service levels, forecast accuracy/error and lead time variability.
If this sounds like your next step to improving how you calculate safety stock, please download our whitepaper which goes into much more detail on how to use statistical safety stock formulas.
Accurately determining safety stock is critical to inventory management
The more accurate you can make your safety stock calculations, the less likely you are to experience out of stock or excess stock situations.
Since buying inventory involves tying-up capital, it’s important to calculate safety stock levels as accurately as possible.
Many companies use simplified approaches to calculating safety stock at the expense of accuracy. Basic formulas work well when demand and lead times are consistent, but in reality this is often not the case.
Instead, a sound, statistical approach to safety stock calculations will deliver the required inventory levels to balance the conflicting goals of maximizing customer service and minimizing inventory cost.
To understand more about how EazyStock inventory optimization software can help ensure you have accurate safety stock levels, contact us today on +1 (844) 416-5000 or request a demo: