
If you keep up with the news about supply chain analytics, you are more frequently encountering the phrase “probabilistic forecasting.” If this phrase is puzzling, read on.
You probably already know what “forecasting” means. And you probably also know that there seem to be lots of different ways to do it. And you’ve probably heard pungent little phrases like “every forecast is wrong.” So you know that some kind of mathemagic might calculate that “the forecast is you will sell 100 units next month”, and then you might sell 110 units, in which case you have a 10% forecast error.
You may not know that what I just described is a particular kind of forecast called a “point forecast.” A point forecast is so named because it consists of just a single number (i.e., one point on the number line, if you recall the number line from your youth).
Point forecasts have one virtue: They are simple. They also have a flaw: They give rise to snarky statements like “every forecast is wrong.” That is, in most realistic cases, it is unlikely that the actual value will exactly equal the forecast. (Which isn’t such a big deal if the forecast is close enough.)
This gets us to “probabilistic forecasting.” This approach is a step up, because instead of producing a single-number (point) forecast, it yields a probability distribution for the forecast. And unlike traditional extrapolative models that rely purely on the historical data, probabilistic forecasts have the ability to simulate future values that aren’t anchored to the past.
“Probability distribution” is a forbidding phrase, evoking some arcane math that you may have heard of but never studied. Luckily, most adults have enough life experience to have an intuitive grasp of the concept. When broken down, it’s quite straightforward to understand.
Imagine the simple act of flipping two coins. You might call this harmless fun, but I call it a “probabilistic experiment.” The total number of heads that turn up on the two coins will be either zero, one or two. Flipping two coins is a “random experiment.” The resulting number of heads is a “random variable.” It has a “probability distribution”, which is nothing more than a table of how likely it is that the random variable will turn out to have any of its possible values. The probability of getting two heads when the coins are fair works out to be ¼, as is the probability of no heads. The chance of one head is ½.
The same approach can describe a more interesting random variable, like the daily demand for a spare part. Figure 2 shows such a probability distribution. It was computed by compiling three years of daily demand data on a certain part used in a scientific instrument sold to hospitals.
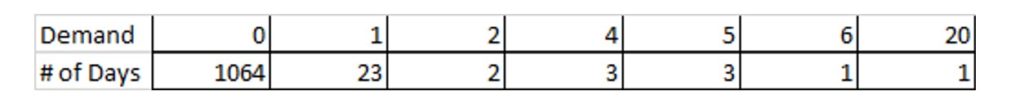
Figure 1: The probability distribution of daily demand for a certain spare part
The distribution in Figure 1 can be thought of as a probabilistic forecast of demand in a single day. For this particular part, we see that the forecast is very likely to be zero (97% chance), but sometimes will be for a handful of units, and once in three years will be twenty units. Even though the most likely forecast is zero, you would want to keep a few on hand if this part were critical (“…for want of a nail…”)
Now let’s use this information to make a more complicated probabilistic forecast. Suppose you have three units on hand. How many days will it take for you to have none? There are many possible answers, ranging from a single day (if you immediately get a demand for three or more) up to a very large number (since 97% of days see no demand). The analysis of this question is a bit complicated because of all the many ways this situation can play out, but the final answer that is most informative will be a probability distribution. It turns out that the number of days until there are no units left in stock has the distribution shown in Figure 2.
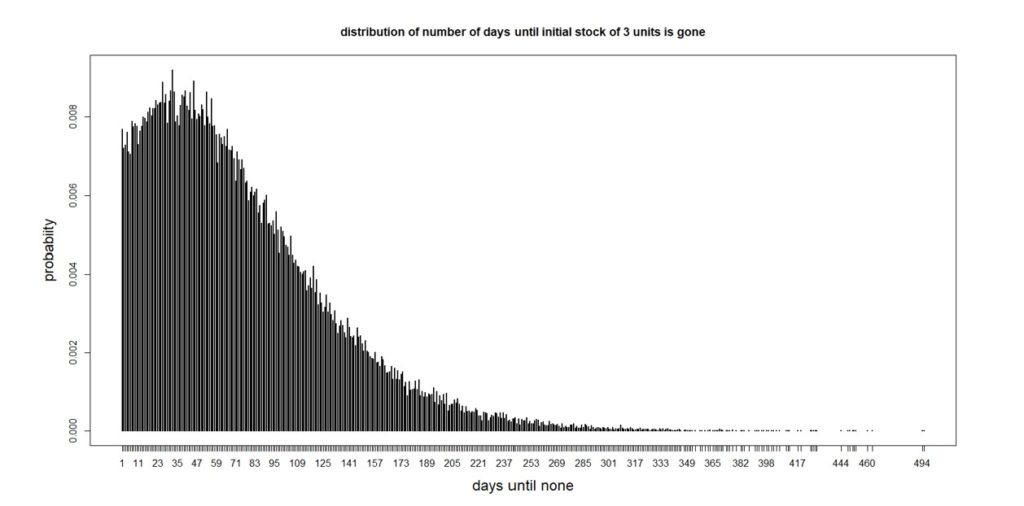
Figure 2: Distribution of the number of days until all three units are gone
The average number of days is 74, which would be a point forecast, but there is a lot of variation around the average. From the perspective of inventory management, it is notable that there is a 25% chance that all the units will be gone after 32 days. So if you decided to order more when you were down to only three on the shelf, it would be good to have the supplier get them to you before a month has passed. If they couldn’t, you’d have a 75% chance of stocking out – not good for a critical part.
The analysis behind Figure 2 involved making some assumptions that were convenient but not necessary if they were not true. The results came from a method called “Monte Carlo simulation”, in which we start with three units, pick a random demand from the distribution in Figure 1, subtract it from the current stock, and continue until the stock is gone, recording how many days went by before you ran out. Repeating this process 100,000 times produced Figure 2.
Applications of Monte Carlo simulation extend to problems of even larger scope than the “when do we run out” example above. Especially important are Monte Carlo forecasts of future demand. While the usual forecasting result is a set of point forecasts (e.g., expected unit demand over the next twelve months), we know that there are any number of ways that the actual demand could play out. Simulation could be used to produce, say, one thousand possible sets of 365 daily demand demands.
This set of demand scenarios would more fully expose the range of possible situations with which an inventory system would have to cope. This use of simulation is called “stress testing”, because it exposes a system to a range of varied but realistic scenarios, including some nasty ones. Those scenarios are then input to mathematical models of the system to see how well it will cope, as reflected in key performance indicators (KPI’s). For instance, in those thousand simulated years of operation, how many stockouts are there in the worst year? the average year? the best year? In fact, what is the full probability distribution of the number of stockouts in a year, and what is the distribution of their size?
Figures 3 and 4 illustrate probabilistic modeling of an inventory control system that converts stockouts to backorders. The system simulated uses a Min/Max control policy with Min = 10 units and Max = 20 units.
Figure 3 shows one simulated year of daily operations in four plots. The first plot shows a particular pattern of random daily demand in which average demand increases steadily from Monday to Friday but disappears on weekends. The second plot shows the number of units on hand each day. Note that there are a dozen times during this simulated year when inventory goes negative, indicating stockouts. The third plot shows the size and timing of replenishment orders. The fourth plot shows the size and timing of backorders. The information in these plots can be translated into estimates of inventory investment, average units on hand, holding costs, ordering costs and shortage costs.
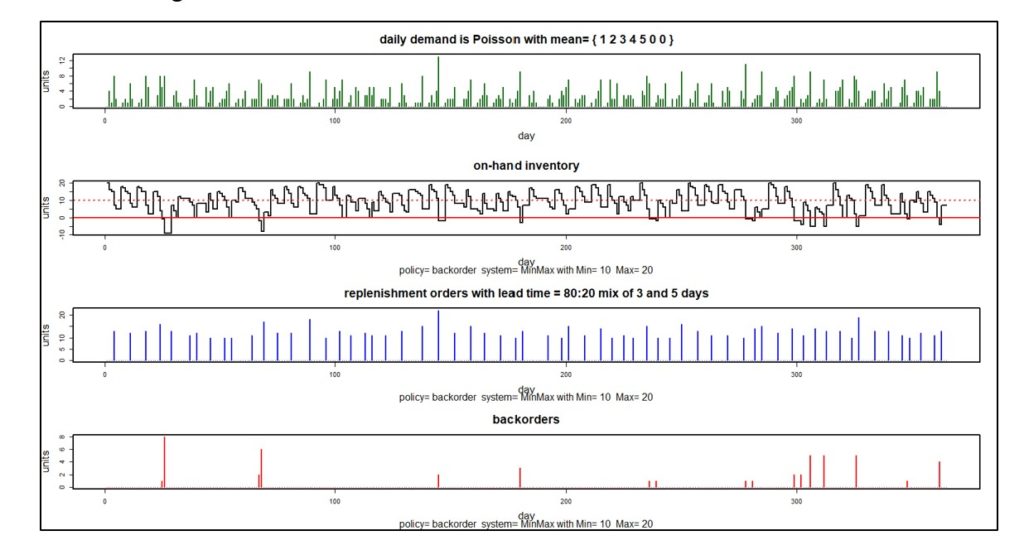
Figure 3: One simulated year of inventory system operation
Figure 3 shows one of one thousand simulated years. Each year will have different daily demands, resulting in different values of metrics like units on hand and the various components of operating cost. Figure 4 plots the distribution of 1,000 simulated values of four KPI’s. Simulating 1,000 years of imagined operation exposes the range of possible results so that planners can account not just for average results but also see best-case and worst-case values.
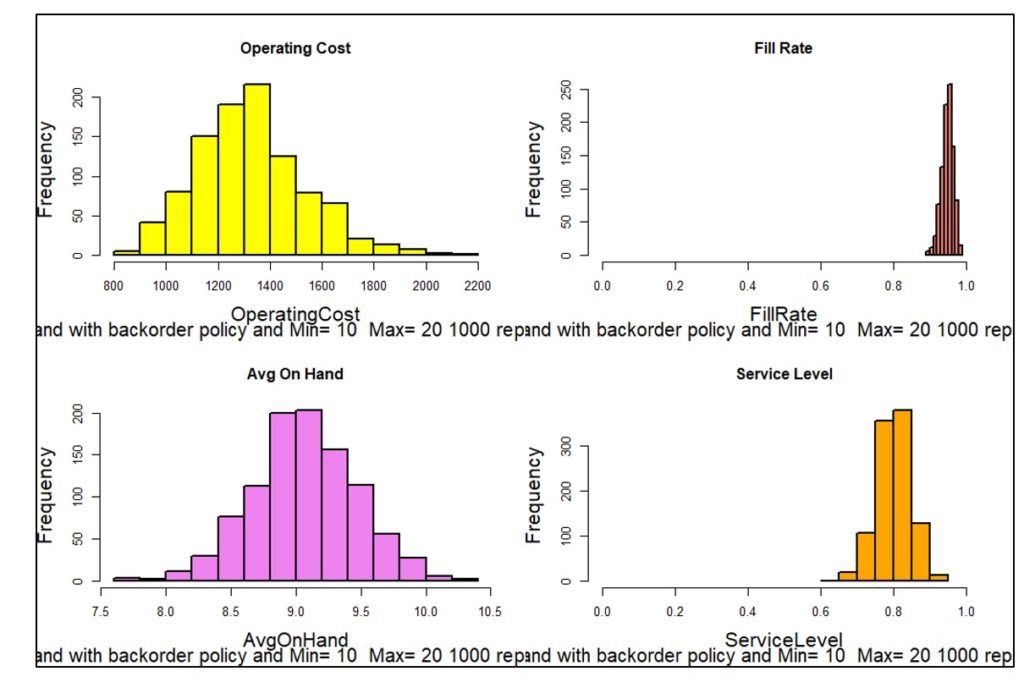
Figure 4: Distributions of four KPI’s based on 1,000 simulations
Monte Carlo simulation is a low-math/high-results approach to probabilistic forecasting: very practical and easy to explain. Advanced probabilistic forecasting methods employed by Smart Software expand upon standard Monte Carlo simulation, yielding extremely accurate estimates of required inventory levels.

Related Posts

Constructive Play with Digital Twins
Those of you who track hot topics will be familiar with the term “digital twin.” Those who have been too busy with work may want to read on and catch up. While there are several definitions of digital twin, here’s one that works well: A digital twin is a dynamic virtual copy of a physical asset, process, system, or environment that looks like and behaves identically to its real-world counterpart. A digital twin ingests data and replicates processes so you can predict possible performance outcomes and issues that the real-world product might undergo.

Direct to the Brain of the Boss – Inventory Analytics and Reporting
In this blog, the spotlight is cast on the software that creates reports for management, the silent hero that translates the beauty of furious calculations into actionable reports. Watch as the calculations, intricately guided by planners utilizing our software, seamlessly converge into Smart Operational Analytics (SOA) reports, dividing five key areas: inventory analysis, inventory performance, inventory trending, supplier performance, and demand anomalies.

How Are We Doing? KPI’s and KPP’s
Dealing with the day-to-day of inventory management can keep you busy. But you know you have to get your head up now and then to see where you’re heading. For that, your inventory software should show you metrics – and not just one, but a full set of metrics or KPI’s – Key Performance Indicators.
Recent Posts
 Smart Software to Present at Epicor Insights 2024Smart Software will present at this year's Epicor Insights event in Nashville. If you plan to attend this year, please join us at booth #13 or #501, and learn more about Epicor Smart Inventory Planning and Optimization. . […]
 Looking for Trouble in Your Inventory DataIn this video blog, the spotlight is on a critical aspect of inventory management: the analysis and interpretation of inventory data. The focus is specifically on a dataset from a public transit agency detailing spare parts for buses. […]
 Big Ass Fans Turns to Smart Software as Demand Heats UpBig Ass Fans is the best-selling big fan manufacturer in the world, delivering comfort to spaces where comfort seems impossible. BAF had a problem: how to reliably plan production to meet demand. BAF was experiencing a gap between bookings forecasts vs. shipments, and this was impacting revenue and customer satisfaction BAF turned to Smart Software for help. […]
 The Cost of Spreadsheet PlanningCompanies that depend on spreadsheets for demand planning, forecasting, and inventory management are often constrained by the spreadsheet’s inherent limitations. This post examines the drawbacks of traditional inventory management approaches caused by spreadsheets and their associated costs, contrasting these with the significant benefits gained from embracing state-of-the-art planning technologies. […]
 Can Randomness be an Ally in the Forecasting Battle?When we try to understand the complex world of logistics, randomness plays a pivotal role. This introduces an interesting paradox: In a reality where precision and certainty are prized, could the unpredictable nature of supply and demand actually serve as a strategic ally? The quest for accurate forecasts is not just an academic exercise; it's a critical component of operational success across numerous industries. For demand planners who must anticipate product demand, the ramifications of getting it right—or wrong—are critical. Hence, recognizing and harnessing the power of randomness isn't merely a theoretical exercise; it’s a necessity for resilience and adaptability in an ever-changing environment. […]

Inventory Optimization for Manufacturers, Distributors, and MRO
 Why MRO Businesses Need Add-on Service Parts Planning & Inventory SoftwareMRO organizations exist in a wide range of industries, including public transit, electrical utilities, wastewater, hydro power, aviation, and mining. To get their work done, MRO professionals use Enterprise Asset Management (EAM) and Enterprise Resource Planning (ERP) systems. These systems are designed to do a lot of jobs. Given their features, cost, and extensive implementation requirements, there is an assumption that EAM and ERP systems can do it all. In this post, we summarize the need for add-on software that addresses specialized analytics for inventory optimization, forecasting, and service parts planning. […]
 The Forecast Matters, but Maybe Not the Way You ThinkTrue or false: The forecast doesn't matter to spare parts inventory management. At first glance, this statement seems obviously false. After all, forecasts are crucial for planning stock levels, right? It depends on what you mean by a “forecast”. If you mean an old-school single-number forecast (“demand for item CX218b will be 3 units next week and 6 units the week after”), then no. If you broaden the meaning of forecast to include a probability distribution taking account of uncertainties in both demand and supply, then yes. […]
 Why MRO Businesses Should Care About Excess InventoryDo MRO companies genuinely prioritize reducing excess spare parts inventory? From an organizational standpoint, our experience suggests not necessarily. Boardroom discussions typically revolve around expanding fleets, acquiring new customers, meeting service level agreements (SLAs), modernizing infrastructure, and maximizing uptime. In industries where assets supported by spare parts cost hundreds of millions or generate significant revenue (e.g., mining or oil & gas), the value of the inventory just doesn’t raise any eyebrows, and organizations tend to overlook massive amounts of excessive inventory. […]
 Top Differences Between Inventory Planning for Finished Goods and for MRO and Spare PartsIn today’s competitive business landscape, companies are constantly seeking ways to improve their operational efficiency and drive increased revenue. Optimizing service parts management is an often-overlooked aspect that can have a significant financial impact. Companies can improve overall efficiency and generate significant financial returns by effectively managing spare parts inventory. This article will explore the economic implications of optimized service parts management and how investing in Inventory Optimization and Demand Planning Software can provide a competitive advantage. […]