Summary
Probabilities are persuasive in supply chains (demand estimation, inventory safety stock, capacity available, etc.) and analytic methods – especially in machine learning where conditional probability is a dominant underlying structure that makes or breaks the success of an application. However, their use is often hidden to supply chain professionals, or at best opaque, written in a formula such as P(s’,r|s,a) (from reinforcement learning). In fact, conditional probability is easy to understand, it is the probability of an event occurring if certain conditions or states are true. An example could be will the probability of the size of the next purchase of ice cream depend on the gender or age of the person making the purchase? As with all estimates, the key to a quality estimate is the quality of the source data. The purpose of this blog is to take the mystery out of the term ‘conditional probability’.
Introduction
We often hear the term probability in a range of settings: sports contests, medical outcomes, and manufacturing quality. Probabilities are persuasive in supply chains (demand estimation, inventory safety stock, capacity available, etc.) and analytic methods – especially in machine learning where conditional probability is a dominant structure. For example, in reading Sutton and Barto Reinforcement Learning an Introduction as part of my Edelman coaching duties, I came across the following conditional probability P(s’,r|s,a) in chapter 3 on Markov Decision Process. This looks daunting, but it simply means the probability of the state of the system at a time (t+1) is conditional on the state of the system at a time (t) and the action to take during this time period. For Walmart’s markdown pricing for clearance products, this says the probability of having I’ units of inventory left at the start of time period 3 is conditional the amount of inventory (I) in the system at time period 2 and the markdown price (this is a, the action) in effect during time period 2. Using this method has been very successful for Walmart and will be presented at the Informs conference.
Read More: What is Statistical Forecasting?
Example
Assume we are investigating the impact of an over the counter medication called FAST in shortening the duration of a cold. Our test situation is whether the cold goes away in “3 days or less” or “lasts more than 3 days” (binary state). “Goodness” can be stated in two different ways
- the probability (risk) of the cold going away in “3 days or less” increases
- the probability (risk) of the cold still being active “after 3 days” decreases
If we randomly assign subjects to either FAST or Placebo at the start of the cold without the patient or provider knowing, then we will have a double-blind controlled experiment. The outcome measured is whether the cold is gone or not gone by day 3. We have a binary condition – that is two possible outcomes (for example heads or tails for a coin toss), where one is defined as a success (S) and the other as a failure (F) without moral judgment. For this example:
- success is defined as the cold being gone in “3 days or less”
- Failure is defined as the cold still being active “after 3 days”
Clearly capturing and analyzing how long the cold lasts, the cold’s level of intensity over time, and how the impact varies for different population segments (age, gender, medical history) would be more meaningful and can be done. A topic for another time.
Data
The data collected for our study is shown in Table 1 as frequency tabulations. There are 153 patients involved in the study, where 92 are assigned FAST and 61 are assigned the Placebo. The four interior cells (shaded) tell us the “joint frequency”. Out of the 153 patients in total, 42 patients received FAST and their cold was gone in three days or less (S- success). 50 patients received FAST and still had a cold after the three days (F-failure). For the 61 subjects receiving the Placebo, 17 were successes and 44 were failures. The outside cells provide us row and column totals. For example, there are 59 successes (across FAST and Placebo) and 94 failures.
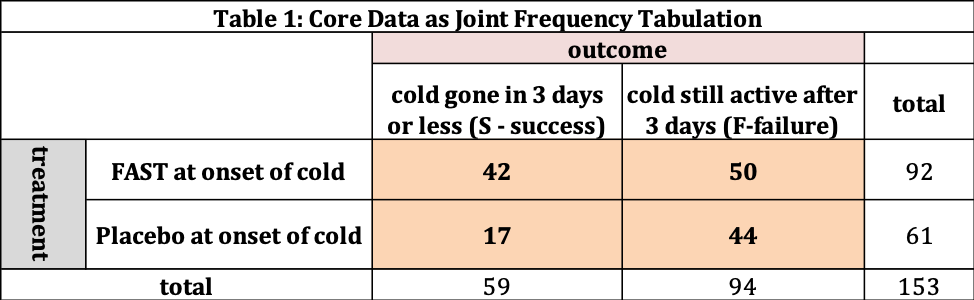
Table 2 converts the frequency information into “percentage” information; The fraction or percentage of the 153 patients in each cell. The official name for this information is “joint probability” distribution – the probability a patient selected at random belongs to one of the four shaded cells. For example, the fraction of the 153 patients in this study that received FAST who’s cold was gone after three days or less is 0.275 (=42/153) → 27.5%.

The total of all four cells (27.5, 11.1, 32.7, and 28.8) is 100%. The “row totals” (38.6 and 61.4) add to 100% as does the column totals (60.1 and 39.9). The row totals have this meaning – if I selected one person at random there is a 38.6% chance their cold is gone in 3 days and 61.4% the cold is still active after 3 days.
Discover More on Forecasting.
Conditional probability – transforming data into a helpful form
The “joint” probability distribution (Table 2) is nice, but of very little value in helping to answer the question – how effective is FAST? We will see the conditional probability distribution is helpful and intuitive – it focusses on the chance or probability of “success” for FAST patients and Placebo patients – that is:
- What is the chance (probability) my cold will be gone in 3 days or less if I take FAST?
- What is the probability my cold will be gone in 3 days or less if I take the Placebo?
We find the conditional probability by dividing the data into two groups: FAST and Placebo. The conditional probability information for this data set is provided in Table 3 and figure 1.
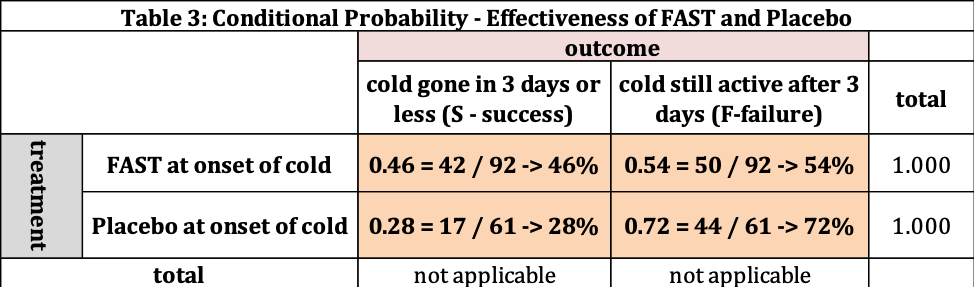
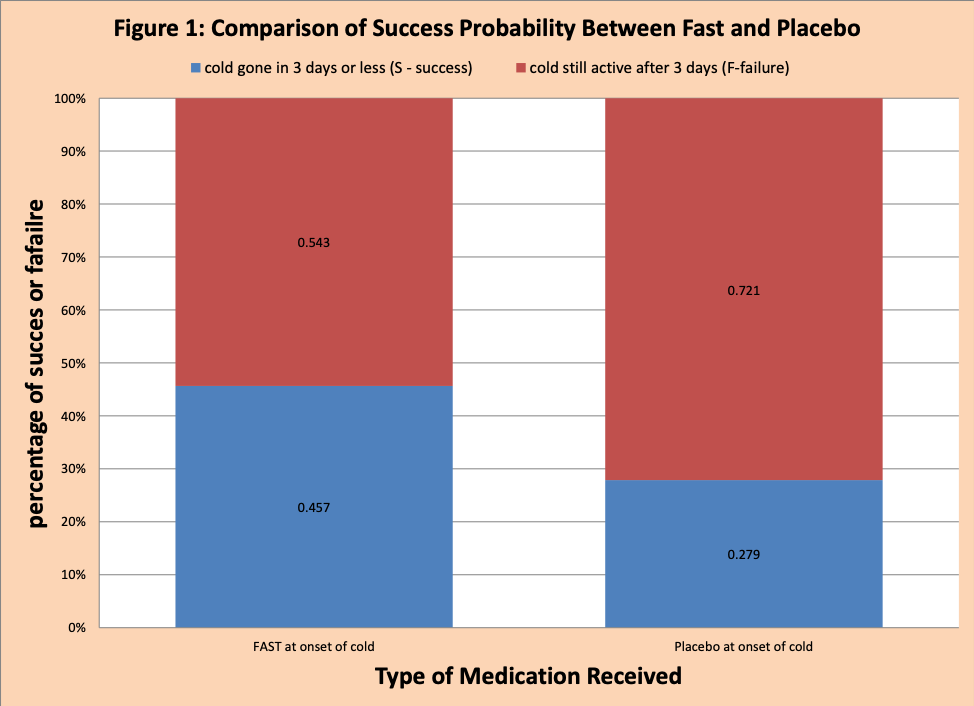
Table 3 provides us the following information:
- There are 96 people who took FAST, where 42 had their cold gone in 3 days or less. This is 46% (42/96). The remaining 50 (54%=50/92) had their cold last longer than 3 days. The probability of success for FAST is 46% and failure is 54%. Where the total is 100%.
- If the patient takes the Placebo, the probability of the cold being gone in 3 days or less is 28% (17/61) and lasting more than 3 days is 72% (44/61).
In Figure 1, there is more blue (success the cold is gone in three days or less) for FAST then Placebo.
The “report card” for FAST from this data set is
- The chances of a cold being gone in 3 days or less improves from 28% to 46% for FAST patients over Placebo patients for an arithmetic improvement of 18% (=46-28). Here BETTER means the probability increases.
- The probability of a cold lasting 3 days or more reduces from 72% with the Placebo to 54% with FAST, improvement of -18% (=72-84). Here BETTER means the probability decreases.
Does the improvement really matter?
Of course, the critical question to the health care professional and patient is: “does the difference really matter”? This can be divided into the following questions:
- What is a reasonable upper and lower bound for the expected fraction of patients who see their cold gone in three days or less when taking FAST?
- What is a reasonable upper and lower bound for the expected fraction of patients who see their cold gone in three days or less with the Placebo?
- Do we have reason to believe the difference in success probability between the two treatments that we see in the sample is simply due to random variation?
- What is an estimate of the actual difference in success probability over a large population?
- Does the size of the difference really matter?
Methods such as confidence intervals and significance tests are just part of the tool kit to answer these questions. This is a topic of discussion for another time. Often data analytics professionals convert the conditional probability to an odds ratio to the assessment of “significance”. See the white paper “Odds Ratio Explained”.
Enjoyed this post? Subscribe or follow Arkieva on Linkedin, Twitter, and Facebook for blog updates.