
Of late, we have been getting a lot of snow in Delaware. No less than three Nor’easters dumped snow on the region leading to school closures and such. During the last storm, I was watching the snow plows go to work and thinking about the amount of planning that must go into the resources needed to deal with the snow – what with salt, and plows needed. That must be a whole supply chain.
I started thinking about whether it would be possible to get historical snowfall data and do some predictions on it. Luckily, I found an article that had the data from 1979-80 till 2015-16, a total of 37 years. What follows here is an attempt to explain the concept of statistical forecasting using this data.
What is Statistical forecasting?
In simple terms, statistical forecasting implies the use of statistics based on historical data to project what could happen out in the future. This can be done on any quantitative data: Stock Market results, sales, GDP, Housing sales, etc. In this example, I am focusing here on the snowfall data set.
To do this analysis, I loaded the data into the Arkieva S&OP Software.
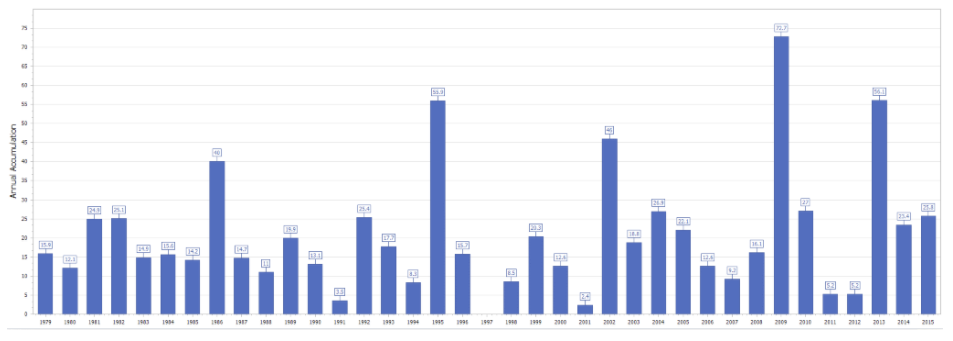
The graph above shows the snow fall amounts for the respective years. Note the lowest point is no snow in 1997-98 whereas the most was 72.7 inches of snow in 2013.
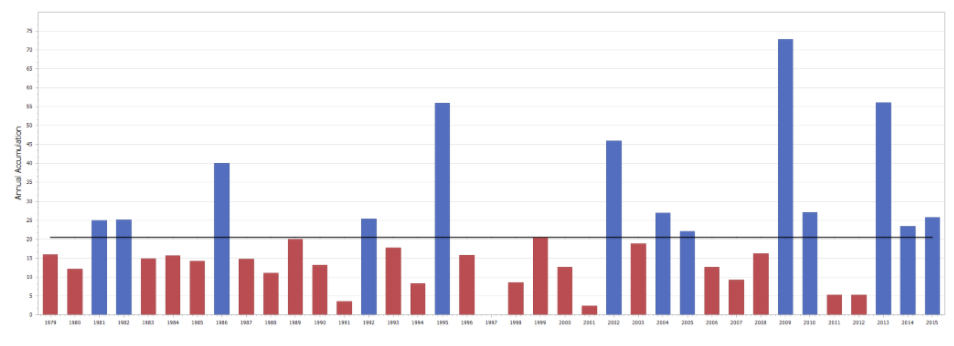
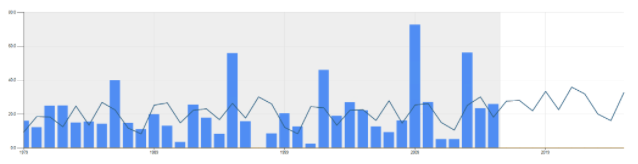
The graph above shows the same data with some more detail. The horizontal line represents the average (20.5). It shows the years where the snowfall was above average in blue and years where it was below average in red.
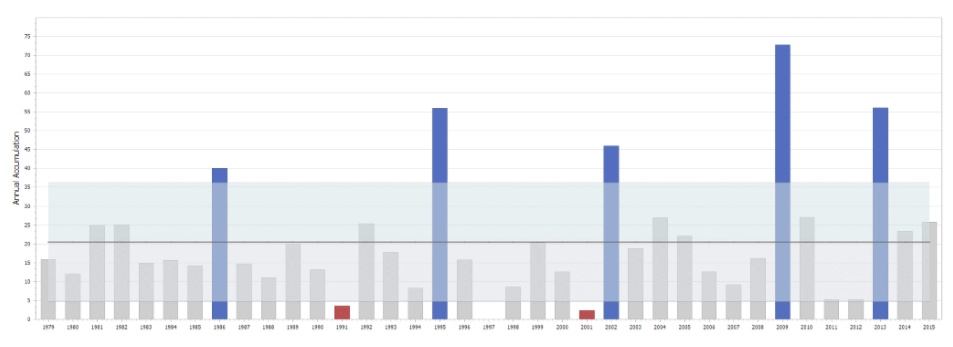
The graph above has the same data but introduces an idea of standard deviation (15.75) from the mean. The shaded band represents an area which is ± 1 standard deviation from the average. Most data points are within this range, but some are outside. (3 below, 5 above).
[Related: The Effect of Currency Demonetization on Statistical Forecasting]In fact, one can do other analyses on this data to determine the different measures of forecastability. Without getting into the details, here is a table of results.
| Measure | Score | Category |
| Coefficient of Variation | 0.77 | High |
| Intermittence | 1.03 | Low |
| Lumpiness | 4.56 | High |
| Bumpiness | -0.08 | Medium |
Sometimes, data like that can raise some questions. Was there really no snow in 1997-98? Or is that an error? Did it really snow that much in 2007? If we have reason to believe that this data is questionable, one can take these data points out and replace them with the average or some other smoothed number. This is generally called outlier removal and can be a key part of the statistical forecasting process. Of course, this should be done with great care.
Understanding the Different Statistical Forecasting Methods
Let us begin with some simple methods of forecasting. These methods are so simple, they should not be called statistical. Suppose one wanted to forecast the snow for the 2016-17 season: one easy way would be to say what happened in 2015-16 (25.8 inches) will repeat in 2016-17. Another simple way is to have an idea of a cycle in mind. (Say El Niño rears its head once every 8 years). Then, one could say that snow in 2016-17 would be equal to what happened 8 years ago in 2008-09 (16.1 inches).
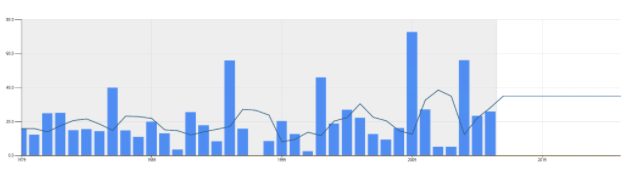
Next up are methods that deal with moving averages. So, in this case, the forecast for 2016-17 would be the average of the last 3 (or last 6 or 9 years). It can be a simple average or a weighted average (with more weight on more recent periods. Typically, this results in a flat-line forecast. Methods with names like average, period average, weighted average, and exponential smoothing all belong to this class of methods. See the graph below for an example using the 3-period average method. The forecast for 2016-17 is 35.1 inches.
If there is a reason to believe there is an up or down trend in the data, then a method that tries to find a linear trend might be applicable. Methods like Linear Regression, Double Exponential Smoothing try to find linear trends in the data. See below for an example using a linear trend. The forecast for 2016-17 using this method is 26.7 inches.
[Read More: How Does a Change in Demand From a One-Time Event Impact Future Forecast? ]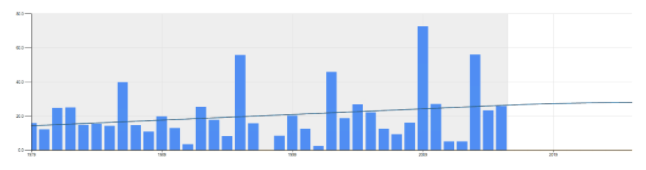
We talked earlier about the El Niño cycle. Suppose one wants to use a method that takes into account this idea of cycles. Methods like Winters, Seasonal, Lewandowski, etc. are designed for it. (Seasonal of course is designed for cycles correlating to seasons every 12 months). See below the graph for the forecast generated using Winters Additive method. The forecast for 2016-17 is 27.7 inches.
Then there are special methods like Arima (based on auto-correlation), Croston’s (if your data is intermittent; this data is not), and Multi-variate regression (if you know that there are certain causal factors affecting the outcome; I do not have any causal factors for snowfall). Below is a result of the Arima method. The forecast for 2016-2017 is 23.1 inches.
[Read Also: A 6-Step Guide to Improving Your Statistical Forecast Technique]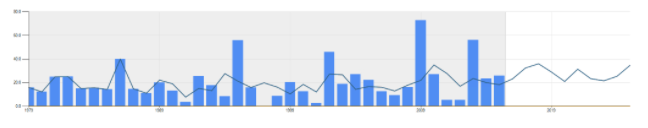
So, now that we have gone through a quick review of the types of statistical methods, let us tabulate the results.
| Method | Forecast for 2016-2017 |
| Average over entire period | 20.5 |
| Same as Last Period | 25.8 |
| Same as Last Cycle | 16.1 |
| 3 Period Average | 35.1 |
| Linear Regression | 26.7 |
| Winters Additive (cycle = 8) | 27.7 |
| Arima (cycle = 8) | 23.1 |
Now because we are in 2018, we can check what happened in 2016-17. In fact, per the internet, the total snowfall was 11 inches, considerably below the average, as well as the forecast calculated by all these methods above. This can lead to two further discussions: On forecast accuracy and how to pick the best-fit method. But that is for some other day.
[Read More: Can Demand Segmentation Improve Your Statistical Forecast?]Enjoyed this post? Subscribe or follow Arkieva on Linkedin, Twitter, and Facebook for blog updates.