
Open order history plays an important role in demand planning, especially for business-to-business companies.
What is an Open Order?
An open order is defined as an order placed by the customer which is under process and is yet to be fulfilled by the supplier. For effective analysis, open order data needs to be recorded daily in an ERP system. A minimum of twelve to eighteen months of open order history is required for your sales forecasting analysis and fine-tuning process. A shorter period could render unreliable and skew the results of your data analysis.
Challenges of Sales Prediction with Limited Open Order History
Results from analysis of available data have an inherent error of a probable value and an expected range. Below are some of the challenges while dealing with limited open order data for analytical purposes.
- Unreliable: The results from the available limited data represents the current conditions and assumptions and cannot be extrapolated to a different set of conditions.
- Skewed: Based on the timing or the range of data collection, the results can be heavily tilted towards the existing parameters and cannot be applied to different parameters.
- Fluctuating: The results from the one set of limited data can vary greatly from the results of another set of limited data on the same conditions but with different time periods.
- Wide ranged: The difference in the upper and lower range of limited data will vary hugely with a different set of parameters.
- Moving averages: The mean value of the limited data points will keep shifting without any reliable movement prediction.
Case study: How forecast accuracy increases with increased data points
The example below demonstrates how forecast accuracy increases with increasing data points. Similarly, the effectiveness and reliability of open order data increase with the increase in the volume and range of the open order data.
Week 1
The example shows a case of how forecast accuracy increases during the month. In this case, by week 2, there are enough indications to increase the supply of the product being measured.
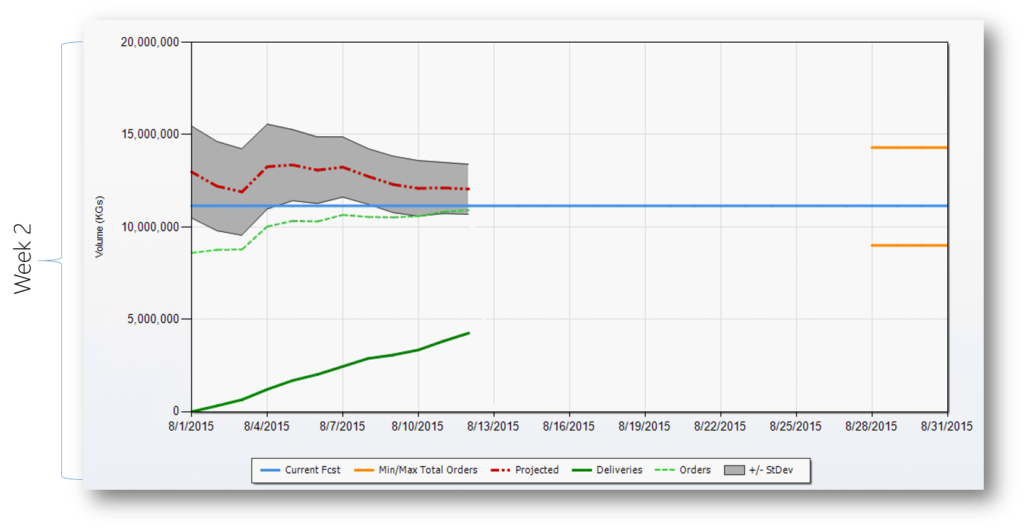
Figure 1: Notice the wide range at the beginning of the month
[Read More: The Art and Science That Keeps You Guessing]Week 2-3
As the data increases in week two, you can see that there is a better chance of predicting sales as shown in Figure 2 below.
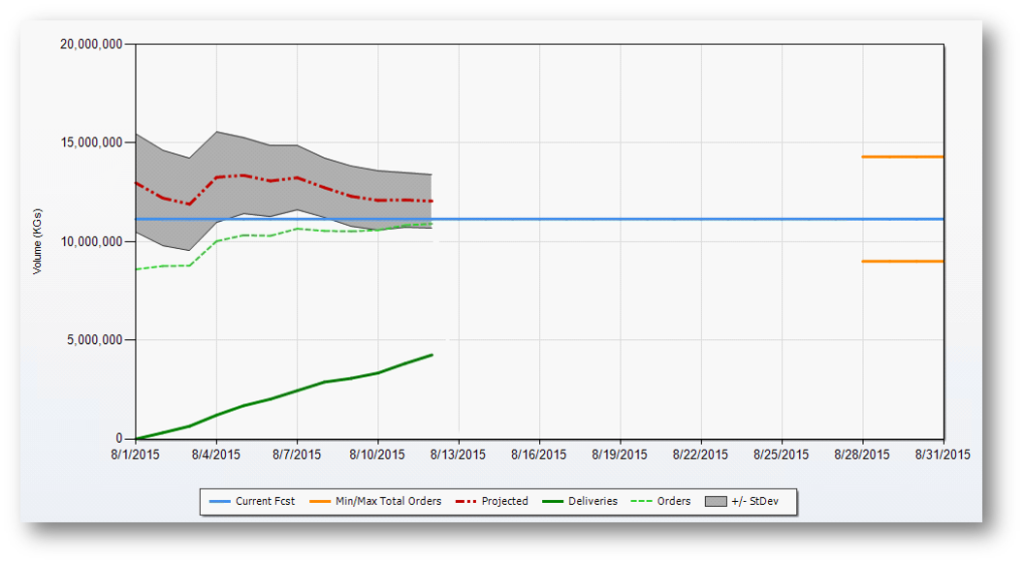
Figure 2: More data means better prediction
Week 4
By week four, as shown in the graph below, there is no doubt that the current demand supersedes the projected demand.
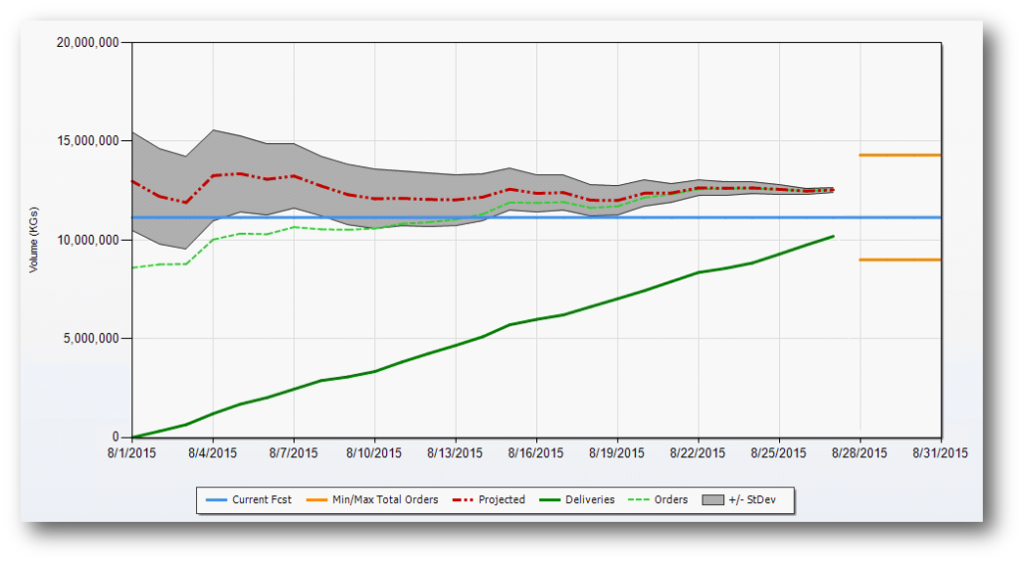
Figure 3
From the above case study, it is clear that there is a wide range and more fluctuations of data points at the start of the month. As the month progresses, the range narrows and the data points begin to consolidate into an identifiable pattern. By the end of the second week, the sales projection becomes clear and justifies action to increase the supply to meet the demand which will be higher than the original sales forecast.
[Read More: The ‘Secret Sauce’ to Improving Demand Planning]
Calculating Your Sales Predictions
Similarly, the volume of data for open order history has a direct impact on forecasting analysis and adjustments. Larger volumes and a wide range of open order history across twelve to eighteen months help determine a reliable predictor ratio (refer to Figure 5 below).
What is the Predictor Ratio?
The Predictor ratio is the ratio of the actual total shipments of M1 (next month) and the open orders of M1 as of a particular date in M0 (current month).
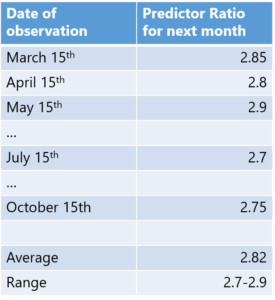
Figure 4: Sample Predictor Ratios
A reliable predictor ratio applicable for the current period under consideration is derived from a historically similar period/season of the business. This predictor ratio provides the average value and the range to be considered. Use this average value and range to plot projected sales vs. current forecast. Timely proactive action based on the sales projections can help improve inventory planning, save on inventory costs, increase customer satisfaction, maximize asset utilization and support new sales opportunities.
Historical data from open orders are generated from large volumes of structured and unstructured big data. This data in most cases, so large that it’s impossible to process and analyze the data with traditional tools and techniques. Hence, leading to need for a more robust demand planning solution. Aligning your sales forecast with current data trends is an essential part of improving your demand planning process.
Enjoyed this post? Subscribe or follow Arkieva on Linkedin, Twitter, and Facebook for blog updates.