The demand planning or management (DM) process and software are one of the major activities in supply chain management, and consists of the following components – gather and capture key data, analyze the data, create a demand estimate or forecast, and ongoing evaluation and alerts.
Within the demand estimate activity, the firm must predict or forecast the future demand on products or groups of products. Analytical methods can be divided into time series forecasting, causal models (a leading indicator), or structural (life cycle), where time series is the most common in traditional DM.
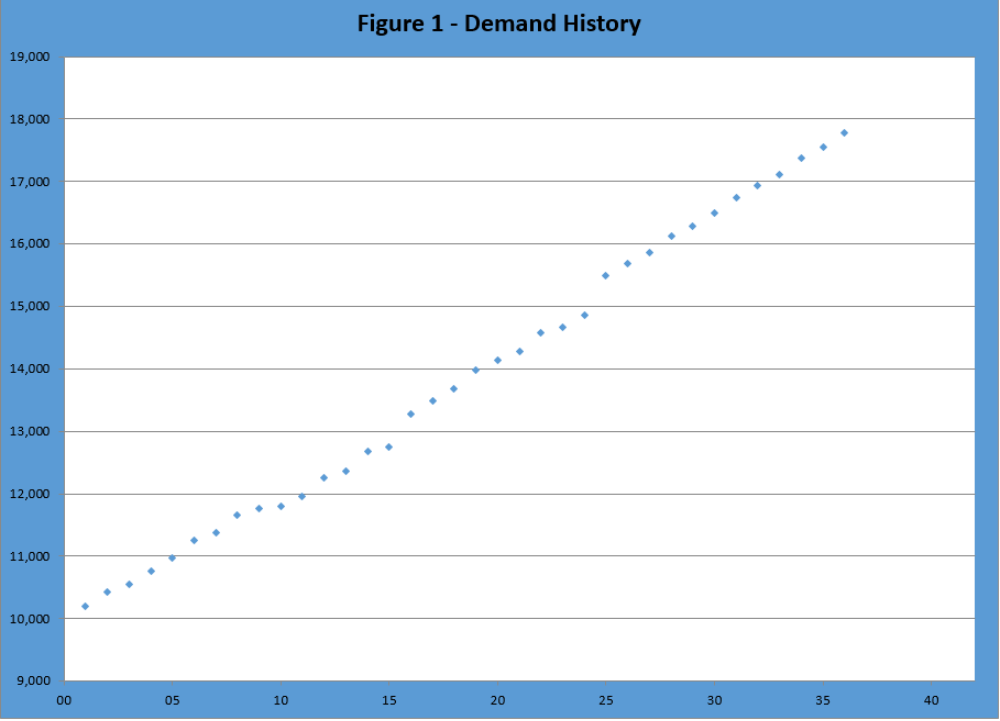
Time series uses only the past history of product demand or groups of products and applies methods to find a trend (“steady” increase or decrease), seasonal fluctuations, cyclical patterns, and jumps. For ease of illustration, we will use an example only with a trend where we have 26 periods of demand history.
Read More: What is Demand Planning Software?
Deciding Between Fit or Predict Demand Analytical Methods
How do we best use this data to estimate the future?
A simple approach (often seen in a basic business analytics class), would find the best-fit straight line across all 36 points and use this line to project future periods as shown in Figure 2 below.
- The trend is an increase in sales of 222 units each time period with a base of 9759. The measure of “goodness” – R-squared, is reasonably high at 0.99. However, inspecting the graph, we see the early periods are all below the “best-fit line” and the later periods are above the line as opposed to being randomly on each side of the line.
- Second, does what appears to be a small estimate error on the graph – perhaps 100 – actually have a large impact on the factory?
- Third, and critical, the “measure of goodness” is how well this straight line fits the existing demand history; it never attempts to measure its ability to predict the future.
Read More: Can Demand Segmentation Improve Your Statistical Forecast?
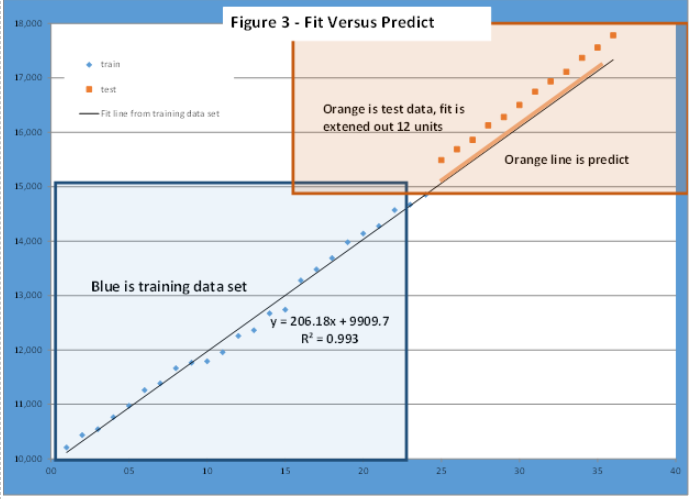
Best practice is dividing the 36 observations into the “fit or training group” and the “predict group.” For this example, we use the first 24 points as the fit group and the last 12 points as the predict group as shown in Figure 3.
Step 1: Find the best fit straight for periods 1 to 24. In figure 3 the blue points (lower left) are the first 24 demand history observations where the best fit straight line for these 24 points has a base of 9910 and a slope of 216 – that is the trend is an increase in demand of 216 units each period. The measure of “goodness of fit” for these 24 points is r-squared of 0.993 – a very good fit.
Step 2: Uses the fitted curve from Step 1 to predict the last 12 demand observation (upper left) in the “predict” group and measure the quality of prediction. Fitted curve refers to the “shape” of the curve and the “best fit” parameter. In this example, the shape is a straight line and the parameters refer to the b0 (9910) and slope (216). The orange line is the predicted values and the oranges points are the actual values.
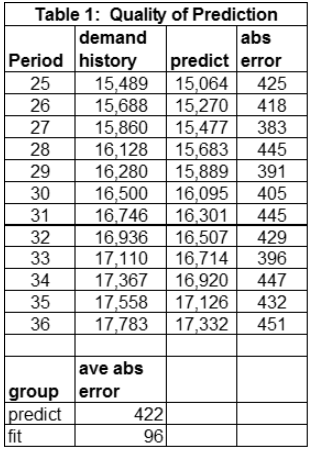
Step 3: Measure the “goodness of prediction” which is different than a “goodness of fit”. Visually we can see the “prediction” is not nearly as good as the fit. Using the metric average absolute error, the “goodness of prediction” is 422 compared to 96 for “fit” (see Table 1).
Conclusion and Lessons
Yes, the “fit is very good”, but the prediction is not. This is because between period 24 and 25 there is a slight “jump up” (see the gap in Figure 1 between points 24 and 25). Finding and fitting this gap is difficult and well outside of traditional time series methods. Predicting is even harder and typically requires the use of the two other methods and human expertise.
- Lesson 1 – understanding the basic concept of the difference between “fit” and “predict” is critical for all demand planners.
- Lesson 2 – It is critical for successful demand management that your software has robust predict methods. Or you have access to this level of expertise – either in-house or from an external vendor.
Enjoyed this post? Subscribe or follow Arkieva on Linkedin, Twitter, and Facebook for blog updates.