When travelling, my personal preference is to take only one plane to my final destination. I know this is more expensive than journeys with connections but I find it a much better overall experience. Of course, sometimes I do have to transit and I must have done this on a few hundred occasions but it is nearly always a nightmare especially in places like CDG and currently in Rome. Whoever designed the temporary airside operations during the terminal extension needs their gene pool membership urgently reviewed.
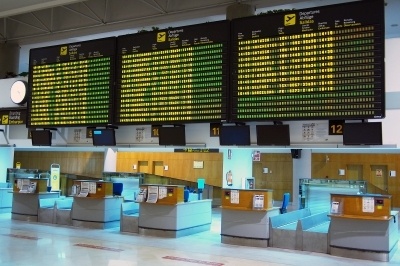
Anyway, during a fairly tight transit you seek out the flight display boards and rapidly scan to see from which gate your next flight leaves and if there are any delays. Just as you have found the right flight and glance towards the gate number column the display refreshes and you have to start again. Then the code share flights start to show so the flight numbers change unexpectedly.
With few minutes to spare I am not interested in Ryanair being delayed as the captain is carrying out a whip-round to pay for the fuel. Or that the Wizzair flight has been cancelled at the last minute, again! (If you are going to name the company after something that sounds exciting, fast, direct and reliable then try and operate in that way.)
There is so much information on one of these huge airport screens that it takes some time to actually see whether you need to run or take your time to negotiate a loan to in order to buy an airport meal. When you cannot see important information quickly there is the every chance of missing the flight.
This week I have been helping a regional FMCG company define a corporate KPI Performance Scorecard. Like many companies they had plenty of data, KPIs etc and as usual more than one format for period end performance reporting. In all cases the previous brief must have been to limit the report to single A4 pages but cram in as much data/information as possible via minute fonts and creative use of text in all sorts of direction.
 Useful visual colour coded traffic lights were present but there was so much “stuff” on show I did not know where to start let alone focus on what was important and needed the senior team attention. Perhaps this is an unachievable utopia but just one set of traffic lights on a page would provide far greater clarity than a jumble of usually backward looking, defensive statements and assessments.
How would this work?
Green – no need for the senior team to waste their time discussing what is going right. (Certainly valid learning in a different business planning forum.)
Amber/Green – improvement is visible and resources should be applied to keep the indicator moving toward a green light.
Amber/Red – something is slipping here. Why? How? What needs to be done to address the slide?
Red – this is what needs the collective brains of the top team. Spend time on these red items as they will be permanently draining resources without defined leadership and coaching.
Presentations where requests for assistance are obscured by formatting and animation are far less effective than clear, in your face messages.
Must dash, flight to catch and it’s not Wizzair.
Image courtesy of stockimages at freedigitalphotos.net