


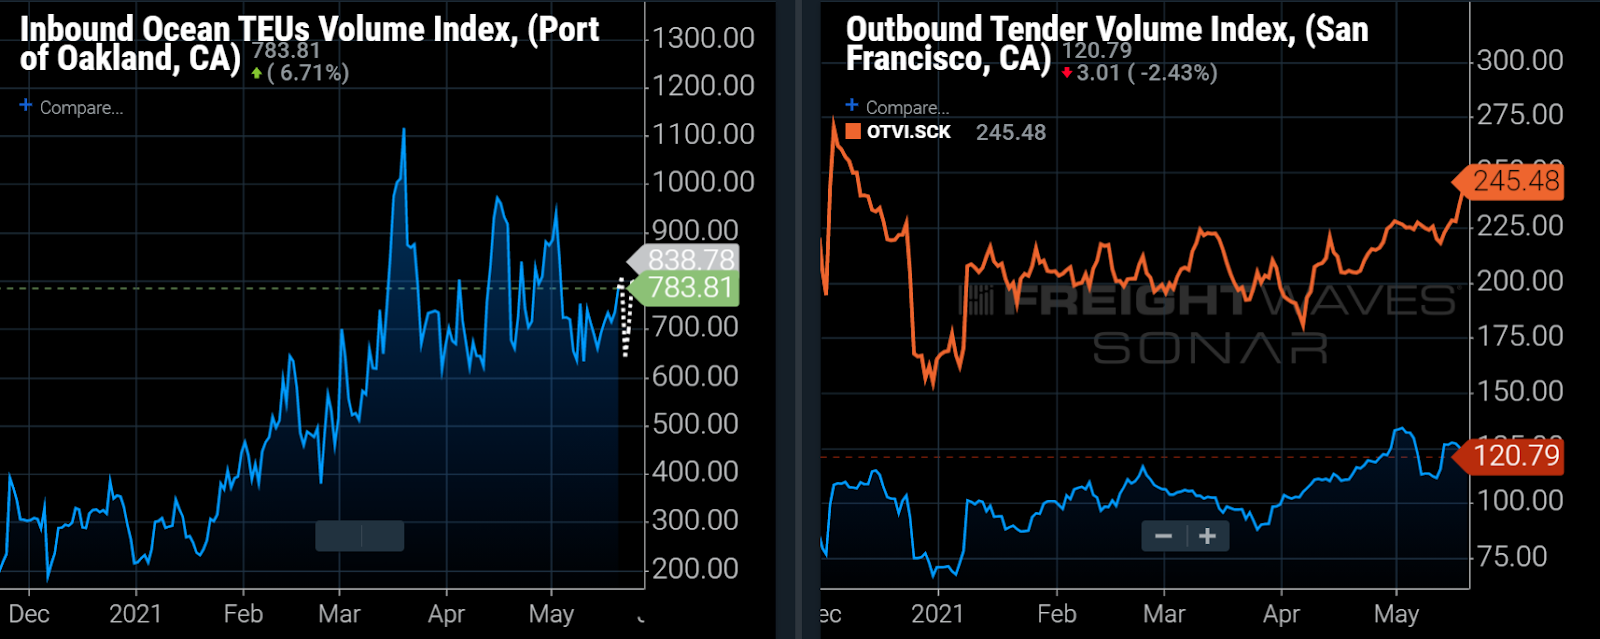
Chart of the Week: Inbound Ocean TEU Volume Index – Port of Oakland, Outbound Tender Volume INdex – San Francisco, Stockton SONAR: IOTI.USOAK, OTVI.SFO, OTVI.SCK
Shippers are booking over two times the amount of freight coming into the Port of Oakland as this time last year — a trend that could make the Northern California markets a much more favorable destination for truckload providers as evidenced by the increasing outbound tender volumes.
Normally a backhaul region, or an area that consumes more freight than it produces, Northern California could see a dramatic increase in outbound freight volumes this summer if the rails are unable to convert quickly enough. There are limitations to how much the existing infrastructure can handle, however.
According to marinetraffic.com, there are numerous ships in the bay and farther out in the ocean waiting to be offloaded. The largest reason for this surge is the fact that Oakland is the fastest point of entry into the U.S. from China outside of the ports of Los Angeles and Long Beach, according to FreightWavesMarket Expert Henry Byers.
The Port of Oakland is not set up to handle the same amount of volume as its neighbors to the south. It handles roughly 2.5 million TEUs per year. The Port of Los Angeles handled over 9 million by itself last year, with Long Beach being accustomed to handling around 8 million.
Outside of the ports, the implications for surface transportation are significant. Trucking may be in a much better position to handle the extra volumes over the rails for a few reasons.

Rail infrastructure is much more static and trains are relatively slow to maneuver. The rails are also busy managing the continuous flow of containers from Southern California. Spot rates have been increasing out of both markets over the past month with intermodal rates out of Oakland exceeding those out of Los Angeles.
Truckload rates are rarely lower out of Northern California than from Los Angeles. As mentioned, the region is normally one of the best-supplied with equipment in the country, thanks in large part to an abundance of northbound freight moving from Southern California.

The Stockton market in Northern California is the consummate example of a backhaul market. It is one of the largest markets in the U.S. for freight but consumes about 25% more freight than it produces — meaning many trucks have to drive or wait for a while before they can get moving with a revenue-producing load.

Tender rejection rates — the rate at which carriers turn down electronic requests for capacity — reflect this relationship as they average well below the national average most of the time. The current average rejection rate of all markets in the U.S. is around 24.5%, whereas the Northern California markets are averaging around 15%. Carriers are much more likely to be able to service their customers in this part of the country because of the inbound volume exceeding outbound demand.

Reefer capacity is an exception to this rule. This is one of the largest areas for produce production in the country, and temperature-controlled or reefer demand increases dramatically during the harvest periods, or produce seasons. One of these is currently underway with the Salinas Valley being responsible for producing over 70% of the nation’s lettuce, among other items.
Northern California may not be the next Los Angeles, but truckload carriers could see an added tailwind from this area in the coming months.
About the Chart of the Week
The FreightWaves Chart of the Week is a chart selection from SONAR that provides an interesting data point to describe the state of the freight markets. A chart is chosen from thousands of potential charts on SONAR to help participants visualize the freight market in real time. Each week a Market Expert will post a chart, along with commentary, live on the front page. After that, the Chart of the Week will be archived on FreightWaves.com for future reference.
SONAR aggregates data from hundreds of sources, presenting the data in charts and maps and providing commentary on what freight market experts want to know about the industry in real time.
The FreightWaves data science and product teams are releasing new data sets each week and enhancing the client experience.
To request a SONAR demo, click here.
