


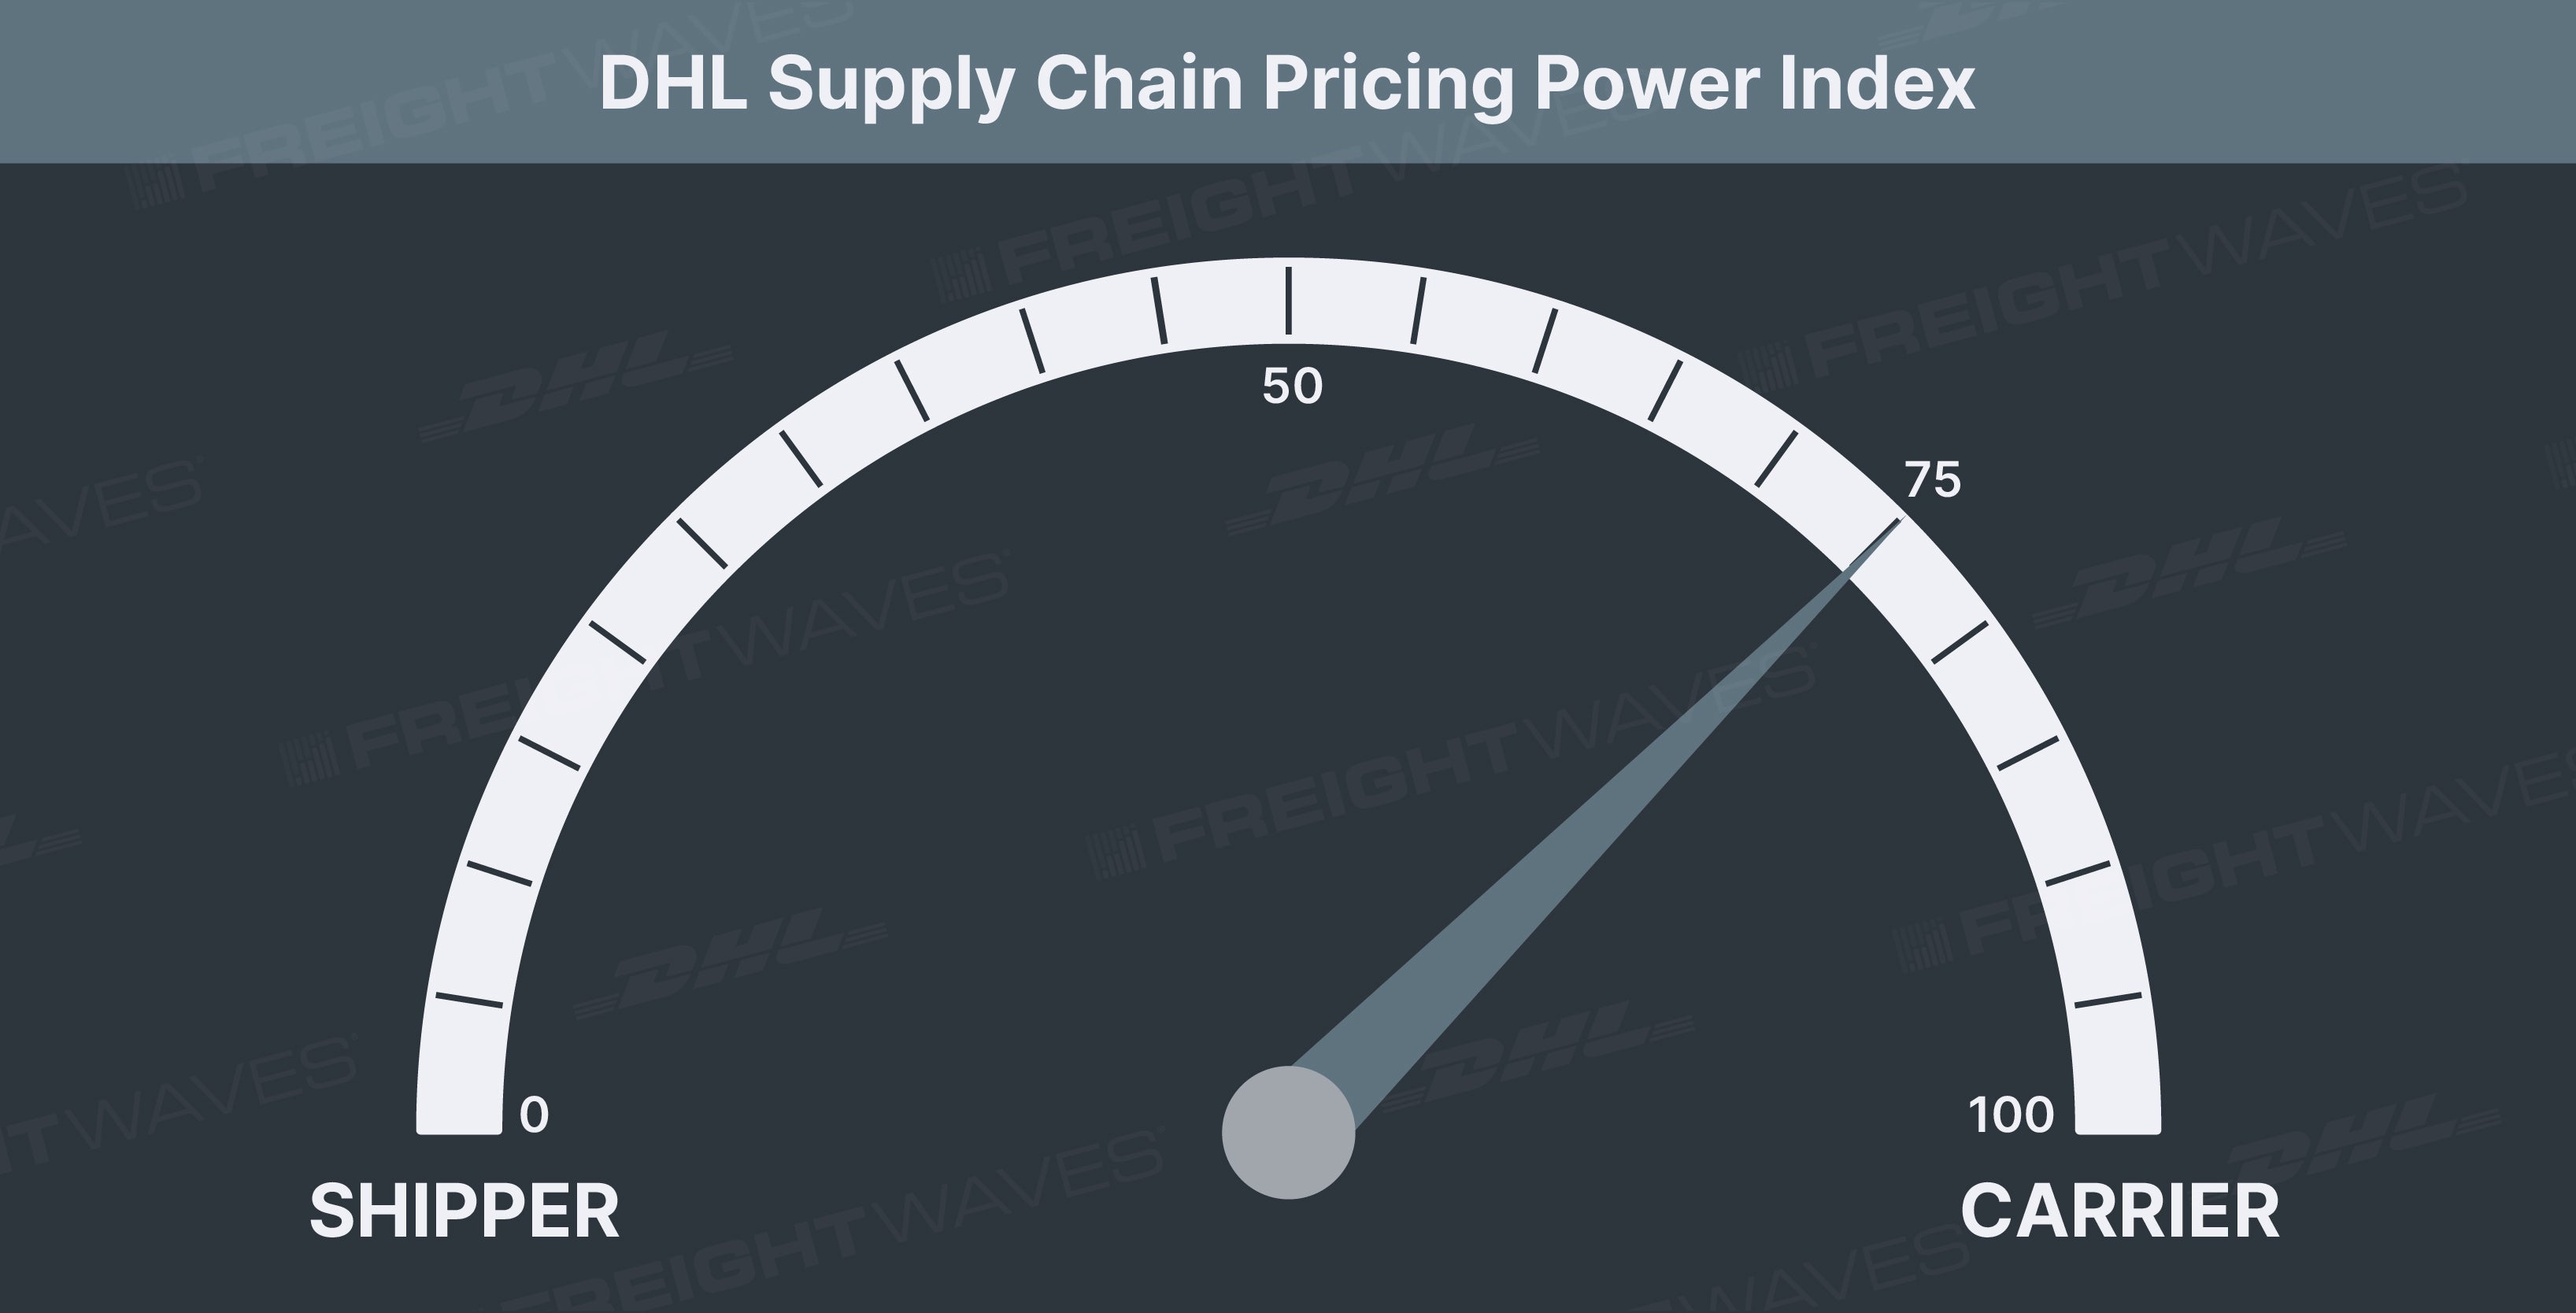
This week’s DHL Supply Chain Pricing Power Index: 75 (Carriers)
Last week’s DHL Supply Chain Pricing Power Index: 75 (Carriers)
Three-month DHL Supply Chain Pricing Power Index Outlook: 75 (Carriers)
The DHL Supply Chain Pricing Power Index uses the analytics and data in FreightWaves SONAR to analyze the market and estimate the negotiating power for rates between shippers and carriers.
The Pricing Power Index is based on the following indicators:
Load volumes maintaining strength against difficult comps
The Outbound Tender Volume Index (OTVI), after setting fresh highs last week, took a breather over the past week. OTVI, a measure of shippers’ requests for capacity, fell by nearly 2% over the past week. After erasing holiday noise last week, volume levels continue to maintain their strength against difficult comps.

SONAR: OTVI.USA: 2021 (blue), 2020 (purple) and 2019 (green)
To learn more about FreightWaves SONAR, click here.
The back half of September is traditionally a stronger period for freight. Volume levels hold strong as shippers have greater need to move freight before the third quarter comes to a close. This year is no different in the fact that volume levels on average were above August levels for much of the month, with the exception of the pullback due to Labor Day. Pulling out the holiday-affected week, on average freight volumes have been over 1% higher than August levels, with no sign of slowing down.
Absolute tender volumes are still running up by nearly 2% year-over-year (y/y) which is remarkable considering that comps have become increasingly difficult during September. As stimulus measures expire, freight demand still seems to be on solid footing thanks to the strength of the consumer. That is going to be beneficial for freight volumes as we enter the traditional peak season, which is forecast to be one of the strongest in recent memory.
OTVI, which includes both accepted and rejected tenders, hasn’t wavered and with rejection rates pulling back during September, accepted freight volumes continue to outperform. Accepted tender volumes, which account for the rejection rate, are running up 8.5% y/y. Though that has narrowed over the past couple of months, the story is still the same: More freight continues to flow through networks that are already bursting at the seams.

SONAR: OTVIW (color) and OTMS (height)
To learn more about FreightWaves SONAR, click here.
Across the country, 80 of the 135 markets tracked by FreightWaves SONAR were lower over the past week. Most of the markets that experienced an increase in volumes are among the smallest freight markets, with volumes in Rapid City, South Dakota, and Wilmington, North Carolina, increasing by 34.43% and 32.3% week-over-week (w/w), respectively.
The largest six markets in the country, which represent more than 20% of total tender volumes, all had a relatively soft week. Volumes in Atlanta, the second-largest market in the country behind Ontario (home of California’s Inland Empire), had the softest week of the six markets as total tender volumes fell 5.4% w/w.
By mode: Reefer volumes have restarted the upward trend established in August over the past couple of days. Over the past week, reefer volumes have increased by nearly 1%, outpacing the overall volume index. Reefer volumes are underperforming compared to a year ago as economies have reopened and restaurant spending has returned. As the Thanksgiving holiday approaches, the movement of frozen turkeys from large poultry-producing areas, like Arkansas, will see an uptick in reefer requests for capacity. Look for reefer volumes to continue to climb higher in the coming months.
Dry van volume levels have started to improve the past couple of days but are still running down over the past week. VOTVI, the dry van segment of OTVI, is down 1.58% w/w but was down nearly 3% earlier in the week. Dry van volumes in Ontario were really the pulldown in the market this week as reefer volumes exploded, increasing by over 15%.

SONAR: Volumes: long-haul (blue), tweener (green), mid-haul (purple), short-haul (orange) and local (yellow)
To learn more about FreightWaves SONAR, click here.
Across the mileage band, long-haul (800-plus miles) volumes have had the best month by far, growing by over 7%. The long-haul volume growth comes as intermodal volumes have suffered due to a number of factors, including chassis shortages and container availability. Intermodal and long-haul truckload volumes typically track relatively close to each other due to the value add of intermodal showing up against long-haul trucking. With the congestion on the rails, shippers have been faced with the decision to shift more volume that would have been intermodal shipments in the past to the highway as the value proposition for intermodal has broken down.
Short-haul (100-250 miles) volumes, which were the leader of the pack for much of August, have pulled back over the past month. Short-haul volumes are down over 2% over the past month while capacity has loosened in the shorter lengths of haul.
Tender rejections relatively stable as third quarter comes to a close
The Outbound Tender Reject Index (OTRI), a measure of relative capacity in the market, started to turn back up during the past week, eclipsing 22% once again. OTRI has followed a similar trend to a year ago, albeit at a slightly lower level. Rejection rates have been above the 20% mark for more than a year, which has led to the tightness in the market becoming normal.

SONAR: OTRI.USA: 2021 {blue} and 2020 {pink}
To learn more about FreightWaves SONAR, click here.
OTRI has been roughly range-bound between 21% and 25% throughout the entire year. Anytime rejection rates have been trending toward the 20% level, there has been resistance that has sent rejection rates higher. As the third quarter comes to a close, shippers are still burdened with trying to secure capacity for contracted rates (which have increased nearly 25% in the past year).
The increase in contract rates over the past year has helped drive better carrier compliance, however carriers are still maintaining pricing power in the market thanks to the unwavering demand. Rejection rates have been running down on a year-over-year basis since the beginning of August, though the gap has recently widened to the widest point of the year, down nearly 400 basis points y/y.
Traditionally, the last week of a quarter leads to a period of tightening as volumes ramp up. Over the past week, rejection rates have increased by 23 bps, ahead of the final week of the quarter. Shippers have to be able to secure capacity to move inventory to necessary locations.
What we have yet to see is rejection rates being impacted by carriers heading into the West Coast markets, Ontario and Los Angeles, for higher-paying freight. Typically when the freight market heats up on the West Coast, carriers essentially camp out on the West Coast, starving other markets of truckload capacity. This leads to rejection rates falling in Southern California markets but rising in a vast majority of the country.

SONAR: OTRIW (color) and OTMS (height)
To learn more about FreightWaves SONAR, click here.
Relative capacity across the country was pretty balanced over the past week in terms of the number of markets that tightened and those that loosened. Seventy-four of the 135 markets in SONAR experienced tightening of relative capacity led by the two tiny North Dakota markets, Bismarck and Fargo, as rejection rates increased by 1,671 bps and 1,589 bps w/w, respectively.
Relative capacity in Dallas loosened more than the other large freight markets over the past week. Rejection rates in Dallas fell by 227 bps w/w to 19.89%. The pullback in rejection rates over the past week has turned them negative compared to the past year, sitting just 71 bps below year-ago levels.
In the other large freight markets, like Ontario, the capacity situation was relatively unchanged over the past week. The rejection rate in the Southern California market has been sub-20% since early July, which is around the same time rejection rates turned negative on a yearly basis. As it stands right now, rejection rates are over 1,000 bps lower than a year ago, but expect some tightening during the last quarter of the year as carriers make final pushes out of the Los Angeles/Ontario area.

To learn more about FreightWaves SONAR,click here.
By mode: Reefer rejection rates continue to climb higher as demand for reefer capacity has started to pick up. After spending the early portion of the year with rejection rates around 50%, the recent drawdown in rejections was likely a welcome sight for shippers needing reefer capacity. Even with the drawdown, reefer capacity has been extremely difficult to secure, especially when compared to the other two equipment types within SONAR. Relative reefer capacity is looser than it was a year ago as rejection rates are down over 400 bps y/y, but reefer demand has slipped as well so securing capacity is still extremely difficult in the current market.
Securing reefer capacity in the Ontario market, which experienced an explosion in demand during the past week, became increasingly difficult as well. Over the past week, reefer rejections in the largest reefer market in the country increased by 572 bps w/w, with the overall rejection rate sitting over 35%.
Dry van rejection rates haven’t moved much the past week, increasing by just 5 bps w/w. Dry van rejection rates — the largest equipment type in the dataset — have erased the entire climb experienced in August, now down 50 bps month-over-month. As demand is expected to stay at the elevated levels, relative capacity is likely to tighten further into the traditional peak season. Any rapid loosening of relative capacity in the coming months is likely driven by the demand side, as opposed to capacity being added fast enough to keep up with demand.
Flatbed rejections did pull back over the past week like in the dry van market. Flatbed capacity, the smallest of the equipment types in the SONAR platform, is still tighter than the dry van market, though October is typically a softer month for flatbed before it picks up in November and December.
Freight rates: Erase last week’s hiccup; positive momentum for carriers resumes
The spot rate data available in SONAR from Truckstop.com is updated at a 10-day lag. It has rebounded from the slight hiccup in last week’s data.

SONAR: TSTOPVRPM.USA (blue, right axis); VCRPM1.USA (purple, left axis)
To learn more about FreightWaves SONAR,click here.
Truckstop.com’s national spot rate, which includes fuel surcharge and other accessorials, climbed by 28 cents per mile to $3.49. The increase erased nearly all of the hiccup in last week’s data when rates fell by 39 cents per mile. The snapback in rates wasn’t a surprise given that the daily volume and rejection rates hadn’t made any significant moves to the downside.
Given the tightness in the market and the strength in freight demand, rates will likely go higher in the coming months. Right now, the Truckstop.com national spot rate is just 11 cents off the all-time high and will likely challenge that level in the coming weeks as carriers become more selective about accepting freight.
The bounce back in spot rates has brought rates back to 18% above year-ago levels, comps with which have been getting increasingly difficult during the back half of 2021. The increase in spot rates this week is thanks to the vast majority of the 102 lanes within SONAR — 87 to be exact — moving higher w/w.
Moving freight out of both Chicago and Elizabeth, New Jersey, became drastically more expensive over the past week. These increases in price are no surprise given that relative capacity in each of the markets last week tightened pretty significantly. Conversely, moving freight out of Atlanta did become cheaper as rejection rates have been below the 20% mark over the past two weeks (the first time since mid-February that rejection rates were under 20%).
Contract rates have continued to climb higher due to the upward trend in spot rates, but also the tightness in the market as well as the freight demand. Contract rates have increased by nearly 25% over the past year and are currently sitting at the highest level in the dataset, which dates back to January 2017.
The rise in contract rates is likely going to weigh on shippers for some time. Those seeking rate relief in 2022 will probably be in for a rough time. In the previous upcycle in 2017-2018, contract rates increased by nearly 20% before plateauing when the market turned during the last couple of months in 2018. In 2019, contract rates were relatively stable even when rejection rates fell to historically low levels. Ultimately, time will tell what happens to contracted rates when market conditions aren’t as fragile, though that is likely a good ways in the future.
For more information on the FreightWaves Freight Intel Group, please contact Kevin Hill at [email protected] or Andrew Cox at [email protected].
Check out the newest episodes of our podcast, Great Quarter, Guys, here.