


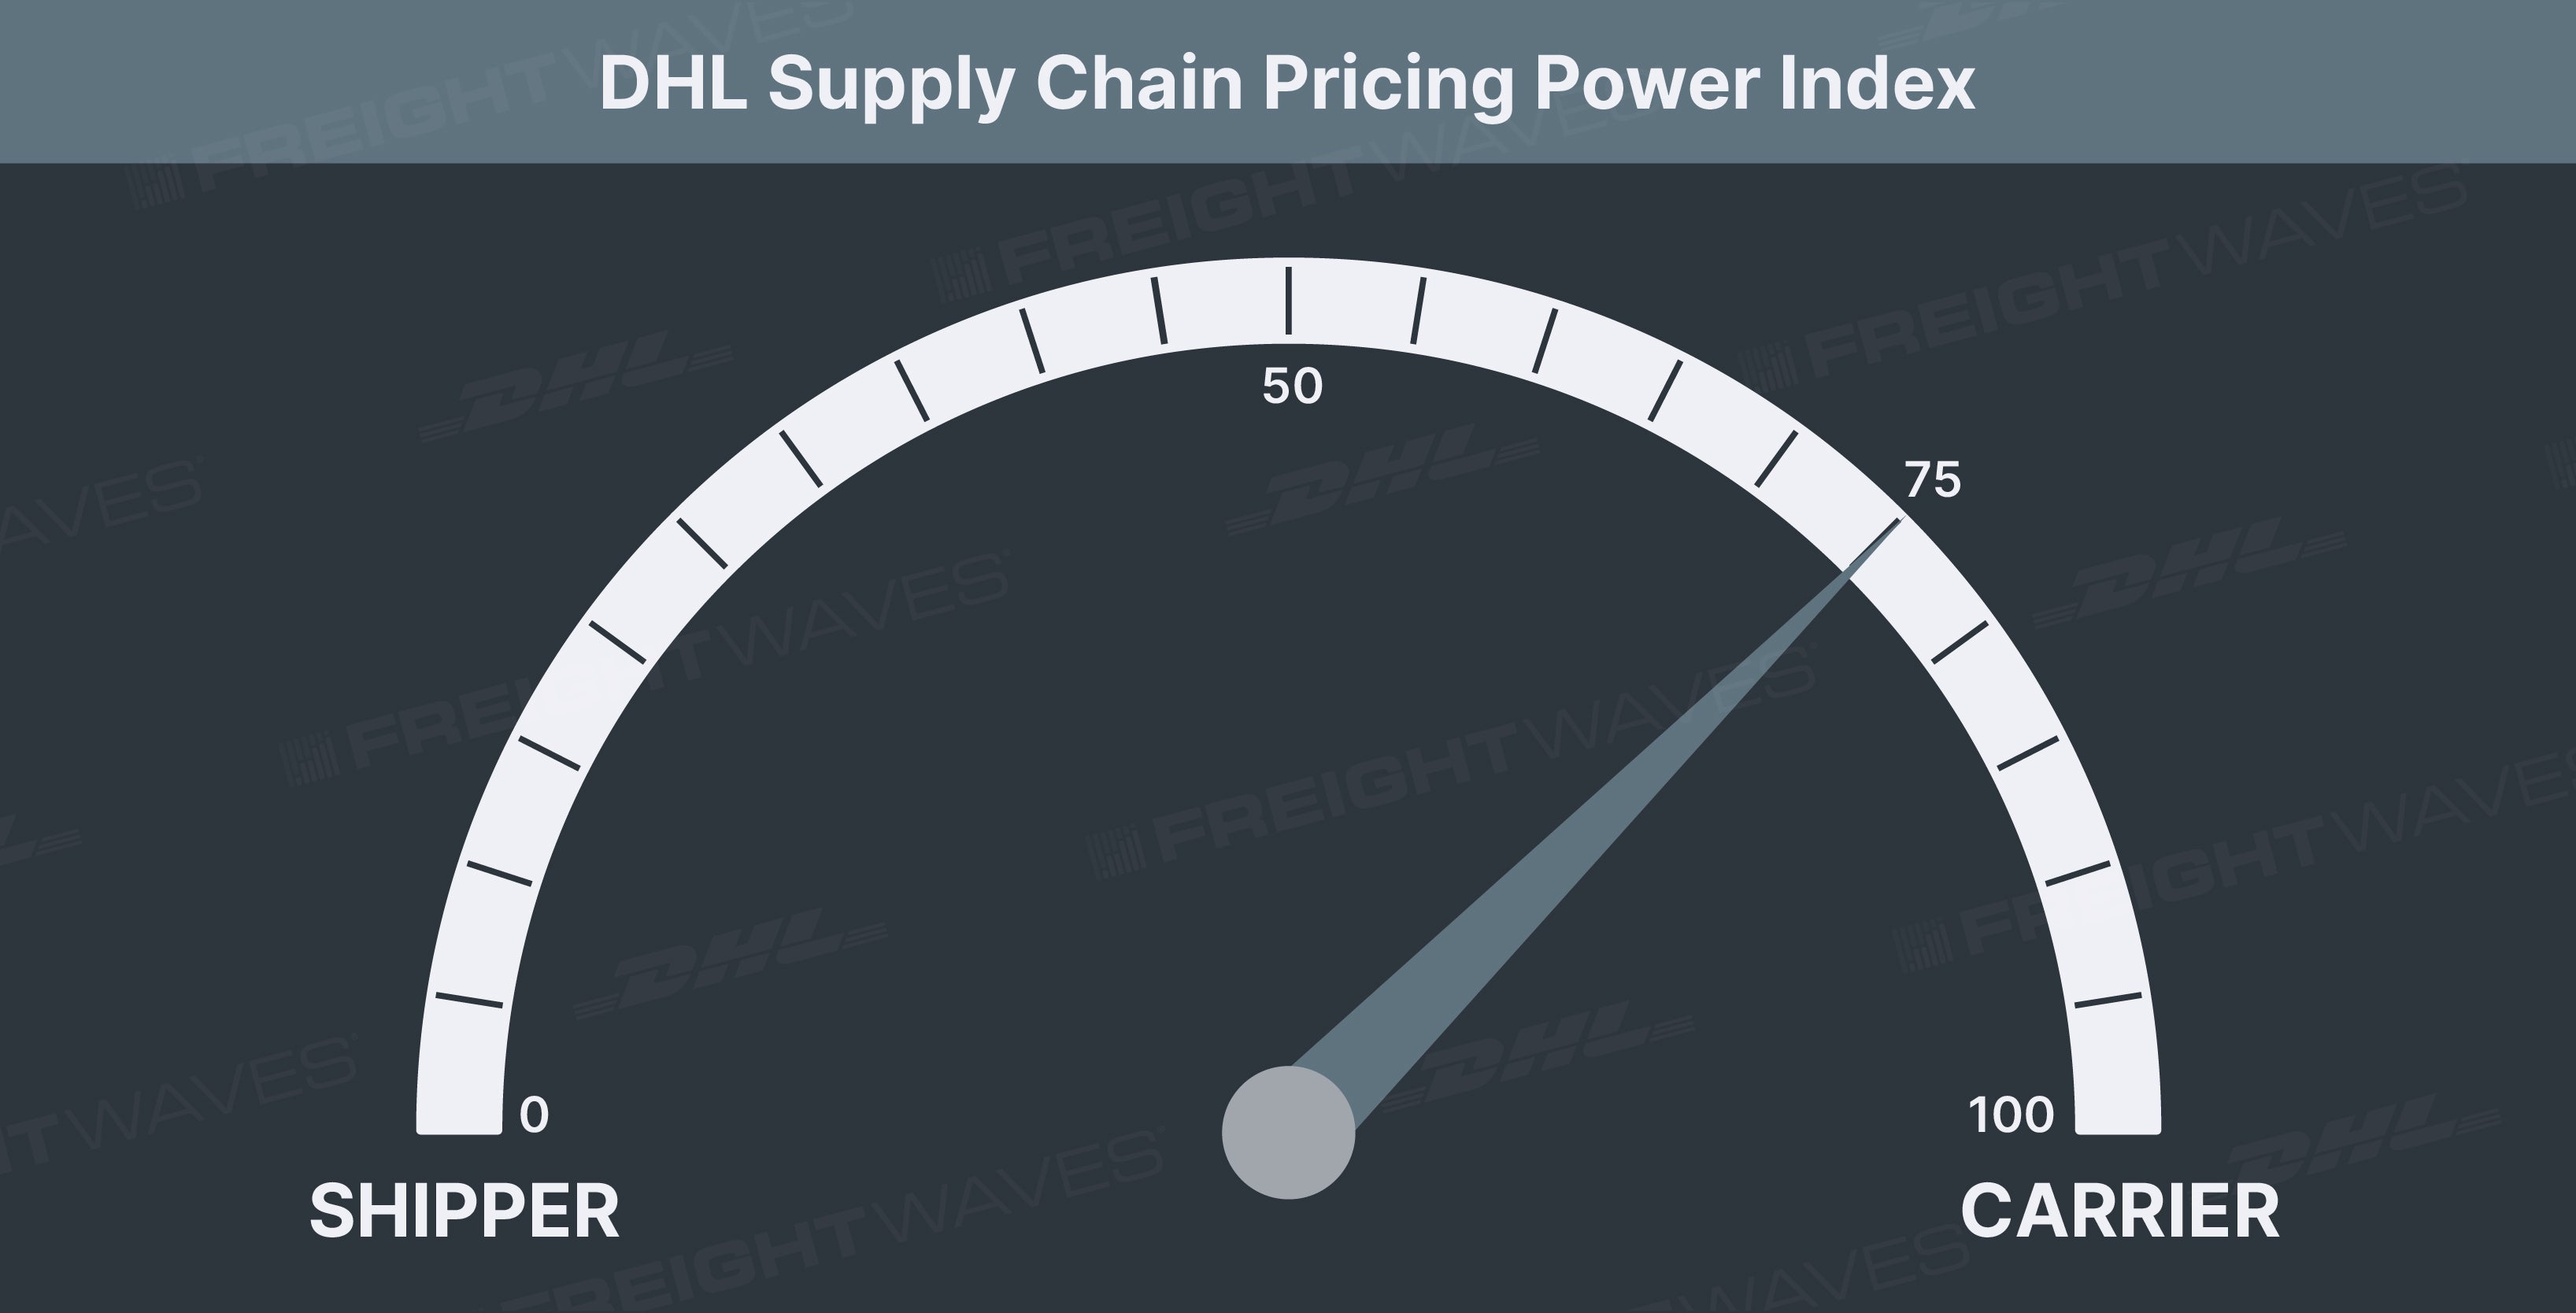
This week’s DHL Supply Chain Pricing Power Index: 75 (Carriers)
Last week’s DHL Supply Chain Pricing Power Index: 70 (Carriers)
Three-month DHL Supply Chain Pricing Power Index Outlook: 70 (Carriers)
The DHL Supply Chain Pricing Power Index uses the analytics and data in FreightWaves SONAR to analyze the market and estimate the negotiating power for rates between shippers and carriers.
The Pricing Power Index is based on the following indicators:
Load volumes: Absolute levels positive for carriers, momentum neutral
The Outbound Tender Volume Index (OTVI) turned positive this week, rising nearly 2% and snapping a multiweek downtrend. Last week’s minor slip was likely influenced by the Commercial Vehicle Safety Alliance’s 72-hour safety blitz, a time when many drivers take off and shippers respond accordingly by pushing or pulling freight away.
Last week, I wrote that the decline in reefer volumes should reverse course in the coming weeks. This week, ROTVI found a bottom and rose for the first time since early March in the wake of the polar vortex disruption. We are in the midst of produce season and quickly approaching a full economic reopening. There are multiple catalysts for reefer volumes over the next several months.
Geographically, this week was strong for many port markets. Norfolk, Virginia, and Savannah, Georgia, on the East Coast and markets up and down the West Coast saw strong volume growth this week. These past two weeks have also seen higher volumes flowing through cross-border markets along the Mexican border.
Volumes are pumping across the country, but it seems routing guides have finally shown signs of improvement. Pair the low volatility in electronic tenders with declining tender rejections, fewer spot volumes and both contract and spot rates headed lower, the picture of an improving environment can be visualized.
Although there are improvements over the road, bottlenecks and disruptions from the oceans will soon impact freight networks once again. The Global Port Tracker from Hackett Associates and the National Retail Federation has revised its already record-high import volume estimates over the next quarter. The freight will keep coming, and it will be fun to watch if carriers can keep on keeping up.

To learn more about FreightWaves SONAR, click here.
Tender rejections: Absolute levels positive for carriers, momentum positive for shippers
Last week’s road checks caused the Outbound Tender Reject Index (OTRI) to rise, breaking a consecutive relative loosening streak. This week, the index resumed its downward trajectory, falling marginally to 24.08%. This is the lowest tender rejection handle since before the winter storm disruptions in February. The momentum is a positive for shippers, but the environment remains the same. Carriers are still rejecting nearly 1-in-4 electronically tendered loads at contracted rates.
Given the trend reversal in reefer tenders, it should come as no surprise that reefer rejections also picked up this week for the first time in many weeks. The Reefer Outbound Tender Reject Index sits at 42%, down from ~50% just a few weeks ago; this is meaningful progression.

To learn more about FreightWaves SONAR, click here.
In a complete 180 from last week, nearly every market west of Utah saw capacity relatively tighten this week. The only markets where tender rejections materially decreased was in the middle of the country. It seems the carrier prioritization of the port markets is continuing.

To learn more about FreightWaves SONAR, click here.
Despite OTRI falling meaningfully for the first time in weeks, I don’t believe it’s due to capacity being added to the market; rather, it’s because contract prices continue to be rebid up and because of drivers returning to the road after Roadcheck Week. This is evidenced by spot prices falling considerably over the past several weeks, while overall freight demand has not. Freight demand is not going to abate in the next few months, and there will not be any meaningful addition to fleet capacity in the meantime. This is a carriers’ market and will stay such throughout the summer.

To learn more about FreightWaves SONAR, click here.
Freight rates: Absolute level and momentum positive for carriers
In a surprising manner, both spot and contract rates pushed higher this week. I have written over the past few Pricing Power Index updates that I felt rates had peaked but would remain elevated throughout the year. However, it seems carriers and brokers are finding ways to squeeze more for longer.
The Truckstop.com national dry van average has popped off since the beginning of May, rising more than 6% over the past two weeks, currently at $3.23/mile, inclusive of fuel. Reefer spot rates have risen even more over the same period, surging from $3.40 to $3.79/mile, inclusive of fuel.
The upward pressure was not contained to spot rates, with FreightWaves van contract rates (VCRPM1.USA) also jumping in the latest week of data. Contact rates are reported at a two-week lag, and if the upward trajectory holds, we could see fresh all-time highs for the index in the coming weeks.

To learn more about FreightWaves SONAR, click here.
Spot rates will remain elevated from a historical standpoint for several months, most likely several quarters. Amit Mehrotra of Deutsche Bank is one of the most bullish analysts in the transportation industry. He believes the elevated freight demand and a very strong pricing environment may last throughout 2022 and into 2023.

To learn more about FreightWaves SONAR, click here.
Economic stats: Momentum and absolute level neutral
Several economic releases this week are worth noting.
Weekly jobless claims were released Thursday and give us one of the best close-to-real-time indicators of the overall economy. This week, the data was again excellent with initial claims falling to 473,000 for the week ending May 8. This was the second consecutive week of initial jobless claims under 500,000 amid the global pandemic.
Though job openings are at a record 8.1 million and nearly 10 million people are officially unemployed, companies are scrambling for labor. Layoffs are at all-time lows. While the jobs market still has a long way to go before it fully heals from the pandemic damage, companies are holding onto their workers amid a growing labor shortage that helped curb job growth in April.
Initial jobless claims (weekly in 2020-21)

Turning to consumer spending, as measured by Bank of America weekly card (both debit and credit) spending data, total card spending (TCS) in the latest week grew 21% over 2019. Smoothing through the weekly gyrations, total card spending has been running at a roughly 20% pace over a two-year period since mid-April. This is considerably above the average pre-pandemic two-year growth rate of about 8% (from 2012-2019).
Spending on durable goods (furniture, home improvement and electronics) has remained extraordinarily robust, growing at a nearly 40% two-year growth rate. The stimulus provided a jolt in spending to a peak of a 64% two-year growth rate in mid-March but the rate of growth has since stabilized. On the other end, spending on discretionary services – airlines, lodging, leisure and restaurants – is up only slightly on a two-year basis.

The biggest turnaround in spending on services occurred from mid-February to late-March when the two-year growth rate increased 20bp. However, since then, services spending has been stable, failing to make further incremental gains. This means that the consumption basket between goods and services spending has been largely stable for the past four weeks. This is fantastic news for carriers and will be monitored closely moving forward.
For more information on the FreightWaves Freight Intel Group, please contact Kevin Hill at [email protected] or Andrew Cox at [email protected].
Check out the newest episodes of our podcast, Great Quarter, Guys, here.
