
F. Robert Jacobs, Ph.D. December 6, 2018
Worker productivity is an important factor in understanding the economy in the United States (and for other economies). Worker productivity, as defined by the U.S. Bureau of Labor Statistics, is the output per hour for workers in nonfarm businesses. It has a major impact on the need for workers as the economy grows. For example, if the economy grows at 2% and worker productivity does not grow, then theoretically 2% more workers are needed. On the other hand, if worker productivity grows at 2%, then there would be no need for additional workers. Here the assumption is that the need for workers is directly proportional to the growth in the economy.
This chart shows average yearly labor productivity and the yearly average percent change in worker productivity over the past 30 years (from the Bureau of Labor Statistics, https://www.bls.gov/#productivity). Also, included in the graph is the labor unemployment rate over the same period. The data shows that overall worker productivity has grown throughout the period. The rate of change increased dramatically in the late 1990s, followed by a decline in the rate of change in the 2002-2010 period. Since 2012, the rate of change in worker productivity has been consistently less than 1.5%. The blips in the rate of change during 1990-1992, 2000-2001, and 2009-2010 were due to economic recessions that occurred during these periods.
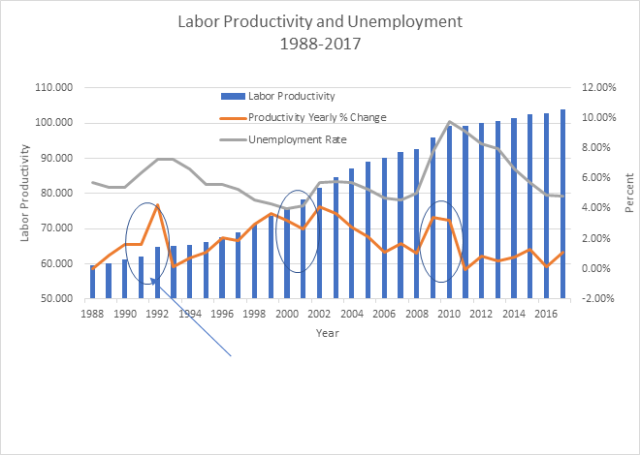
To get the full picture, unemployment rate is shown on the graph. Note how unemployment has significantly dropped since 2010. As discussed, other than higher productivity, another way to keep up with the need for more output is to use more workers. The analysis shows how as the rate of productivity increases, unemployment is reduced. The implication is that the output shortfall is being made up by hiring more workers. Of course, this can only keep happening for a limited time. The concern is that the limited labor force may begin to impact output in the United States. This could be a major economic problem for the United States resulting in a capacity shortfall in the future. This can also lead to an increase in inflation due to higher wages as companies compete for the smaller pool of unemployed workers.
Consider the following example. Assume that next year the Output (think about his as the demand) in our industry is expected to go up 5% from 100 units to 105 units and Labor Productivity is expected to increase by 2%. If the workforce stays at the same level, they could only produce 102 units due to the productivity improvement. In order to reach the full potential of the industry, the extra 3 units need to be produced in some way. There are several ways that this could be done. One might be to work overtime, another might be to hire more workers from the pool of workers that are currently unemployed. If the current unemployment rate is 5%, then if 95% of the workers can produce 102 (=100 x 1.02) units, approximately 97.7% (=.95(105)/102) of the workers would be needed to produce 105 units. This would result in an unemployment rate of less than 3%, which is probably not realistic. It is likely that the workforce might limit potential growth. Also, all the pressure to hire those extra workers might result in some inflation due to the higher wages needed to attract those workers.
To take this a step further, one needs to consider trends in the size of the workforce. This needs to look at trends in the number of people that are looking for work and basic changes in the number of people entering and leaving the potential workforce pool. The Bureau of Labor Statistics tracks data on the Labor Force Participation Rate and the Employment-to-Population Ratio and this data is shown in the following chart.
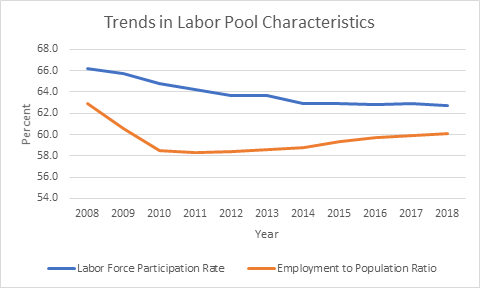
The Labor Force Participation Rate has held steady at a little less than 63% since 2014. The Employment to Population Ratio has increased from 58% to 60% since 2010. This is promising, but the key to whether output will be choked is the actual number of workers that will be available to work. This, of course, depends on the shifting population demographic in the United States.
A projection made by The Bureau of Labor Statistics forecasts that the Labor work force will increase by 6.6% from 159,187,000 to 169,650,000 workers between 2016 and 2026. This is an annual growth rate of only .6%. This projection considers the change in the mix of workers and the growth in the U.S. population. Note that the percent distribution of workers 55 and older moves only from 22.4 to 24.8% between 2016 and 2026, so much of the “aging” of the United States population has already occurred, at least from the standpoint of workers. Disturbing is the projection that the annual growth rate in total workers will only be .6%.
Going back to the previous example, assume that next year the demand in our industry goes up 5% from 100 units to 105 units, Labor Productivity increases by 2%, and the workforce goes up by .6%. In this case, the workforce can produce 102.612 (=100 x 1.006 x 1.02) units due to the increases in workforce size and productivity gains. The remaining 2.388 units need to be produced by overtime or other technology innovations. Given this scenario approximately 97.2% (=.95(105)/102.612) of the workforce will be needed. The unemployment rate would be less than 3%.
It sounds to me like a lot of people are going to be working overtime in the future!
