article thumbnail

Embracing the Supply Chain as A Complex Non-linear System

Supply Chain Shaman

No company in either the household non-durable (consumer goods) or the food manufacturing group beat their peer group on the balanced scorecard of growth, inventory turns, operating margin, and Return on Invested Capital (ROIC) for 2013-2022. The supply chain has two important buffers–inventory and capacity.

article thumbnail

How We Stubbed Our Toe in The Evolution of S&OP

Supply Chain Shaman

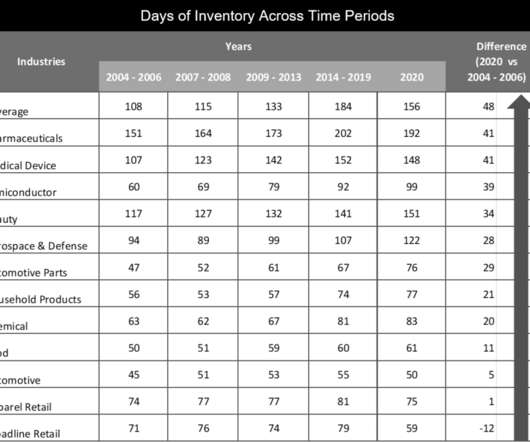
I wrote my first report on Sales and Operations Planning (S&OP) while sitting on the floor in the Atlanta airport in 2005 when I was an AMR Research analyst. Sales and Operations Maturity Model from 2005-2008. Industries carried on average 32 days more inventory in 2020 than in 2007. (I Let me explain. Mistake #3.

S&OP 195
Insiders

Sign Up for our Newsletter

This site is protected by reCAPTCHA and the Google Privacy Policy and Terms of Service apply.

article thumbnail

Measuring Up?

Supply Chain Shaman

The supply chain is a complex system with finite, and non-linear relationships between supply chain metrics that drive balance sheet results. In our analysis, only one out of ten companies successfully improves operating margins and inventory turns at the same time. We find that companies can improve one, but not two of the metrics.

article thumbnail

Seven Misconceptions on Managing Inventory in a Market-Driven World

Supply Chain Shaman

When it comes to the management of inventory in value chains, frustration abounds. Executive, after executive, lament, “They have purchased many technologies and sponsored many projects to reduce inventories, but they are not seeing results.” Inventory is the culmination of many business decisions. Tracking Progress.

article thumbnail

How Supply Chain Lost Its Mojo

Supply Chain Shaman

Improvement on the key metrics of growth, inventory turns, operating margin and Return on Invested Capital (ROIC) is elusive. Then as a software executive (1991-2001 and then 2003-2005) and finally as an analyst (2001-2003 and 2005-present). Here I want to share a perspective of “Why.” Yes, I am an old gal.).

article thumbnail

Getting Ready for 2017: Reflections on Telling Lies

Supply Chain Shaman

As I study research methods, and the market, I realize the lies I’ve spun for prior employers (Gartner and AMR Research) are untrue: The AMR Research Hierarchy of Supply Chain Metrics. This research, released in 2005, gives a compelling view of a metrics hierarchy. Just the opposite.

article thumbnail

Tell Me Why

Supply Chain Shaman

As a result, tor most companies, the goals are unclear and the financial metrics are not well-understood. This year-over-year comparison, enables visualization of performance on two metrics. In Figure 3, the orbit chart is on inventory turns and operating margin. Metric balance is difficult for supply chain teams.