Remove 2009 Remove 2020 Remove Manufacturing Remove Metrics
article thumbnail

The Unleashed Manufacturing Health Index: Signs of Recovery as 2023 Closes

Unleashed

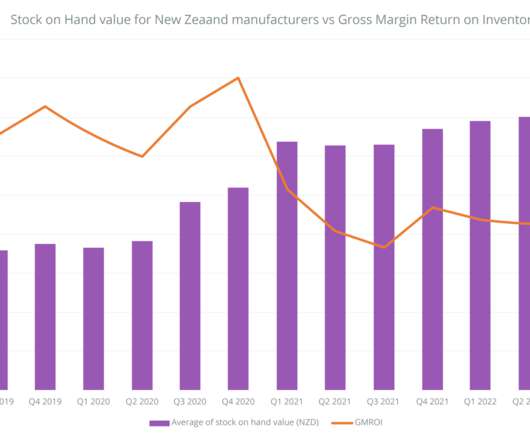
New manufacturing data reveals the small to medium manufacturing sector remains in recovery mode, with global performance largely mapping to local economic conditions. New Zealand manufacturing, meanwhile, is at an historic inflection point, with stagnant performance in multiple sectors.

article thumbnail

The Manufacturers Health Check: Firms Holding Double the Stock Amidst ‘Inventory Crisis’

Unleashed

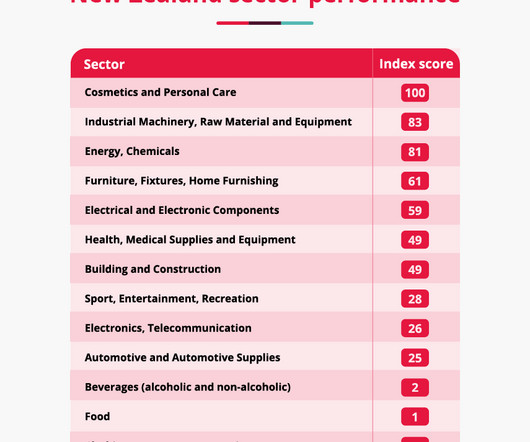
New manufacturing data has revealed which industries and nations are leading the way in the post-pandemic economic recovery – and the tactics they’re using to beat supply chain disruption. We did this by analysing four key metrics: The average value of total stock on hand – reflecting the volume of goods held (plus impacts from inflation).

Insiders

Sign Up for our Newsletter

This site is protected by reCAPTCHA and the Google Privacy Policy and Terms of Service apply.

article thumbnail

Who Should Be In The Winner’s Circle?

Supply Chain Shaman

When Gartner purchased AMR Research in December 2009, the methodology became the Gartner Supply Chain Top 25. Only 29% of manufacturers easily manage total cost trade-offs. The research project analyzed 1200 combinations of 180 metrics for four hundred companies for the period of 2010-2012. The reason? The result? The reason?

Gartner 235
article thumbnail

Achieving enterprise-wide adoption of supply chain risk management

Resilinc

But to make their strongest case, SCRM advocates need to focus on one key metric: return on investment. Collaborate with stakeholders in finance, sales, manufacturing, etc., In the first half of 2020, Resilinc supported its customers in responding proactively to the massive global supply chain disruptions that were occurring.

article thumbnail

The Digital Supply Chain: Making The Leap With A Ball and Chain

Supply Chain Shaman

Last week, I spoke on the evolution of the digital supply chains and my vision for Supply Chain 2020 at the World Trade Group Event in Miami. I had touched some nerves with my five predictions for 2020: Digital, Outside-in Value Networks. I believe the demographics shifts shown in Figure 1 will transform Supply Chain 2020.

article thumbnail

L’Oreal: A Beautiful Supply Chain

Supply Chain Shaman

In the process of compiling the Supply Chains to Admire report for last year’s Supply Chain Insights Global Summit , the research team at Supply Chain Insights calculated the rate of supply chain improvement of companies by industry for the period of 2006-2013 and 2009-2013. We studied this pre and post-recession. Here I share their story.

article thumbnail

Supply Chain Scope: New Study Shows Rise in US Inventories; California Estimated to Improve Freight Efficiency by 25% in 2030

Arkieva

the “inventory to sales” ratio (inventory levels divided by a month’s worth of sales) spiked in late 2008/early 2009 as the recession caught companies with way more inventory than needed versus suddenly shrinking demand. Targets for 2030 Include: Improve freight system efficiency 25 percent by 2030. Read Full Article.