article thumbnail

Supply Chain Performance Declined In the Last Decade. The Question is Why?

Supply Chain Shaman

Rise in Inventories. Less Effective at Inventory Management. Inventories grew twenty days over the decade. Yes, companies held more inventory (measured in days of inventory) in 2019 than at the start of the 2007 recession. Sadly, most of it is the wrong inventory. Despite spending 1.1% Alignment Barriers.

article thumbnail

When the Rubber Hits the Road

Supply Chain Shaman

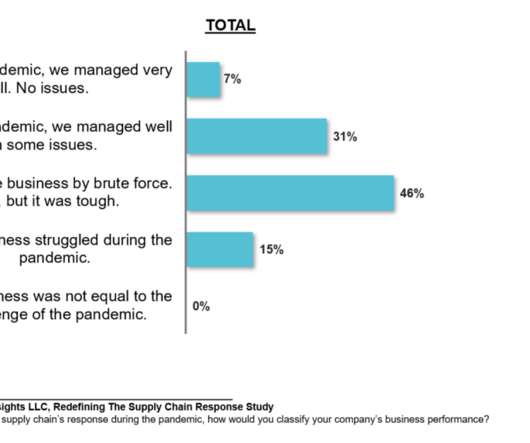
Results in the Automotive Industry for the period of 2012-2021. We find that three factors mattered: organizational alignment, descriptive analytics, and inventory management. Companies driven by functional metrics struggled: they could not adapt quickly to the higher transportation costs.). So, you might ask, why? Conclusion.

Insiders

Sign Up for our Newsletter

This site is protected by reCAPTCHA and the Google Privacy Policy and Terms of Service apply.

article thumbnail

A New Decade: Give Science A Chance

Supply Chain Shaman

When I started my business in 2012, I frequently wrote about the future using the moniker of Supply Chain 2020. Only four percent of companies compared to their peer groups improved balance sheet performance of growth, operating margin, and inventory turns. Days of Inventory Comparison. My focus was simple. What can we learn?

article thumbnail

Who Should Be In The Winner’s Circle?

Supply Chain Shaman

The first step was to charter a research project with the Arizona State University statistics department to analyze which combination of metrics drives the highest market capitalization. The research project analyzed 1200 combinations of 180 metrics for four hundred companies for the period of 2010-2012. The result? The reason?

Gartner 235
article thumbnail

Mush

Supply Chain Shaman

I just don’t think the comparison of very different industries in a spreadsheet based on growth, inventory values, and Return on Assets (ROA) is meaningful. As a result, the metrics have to be viewed together as a pattern over time. In the journey, the supply chain leader needs to improve the potential of a portfolio of metrics.

Gartner 298
article thumbnail

Financial Benchmarking for Inventory Turns and Working Capital

Arkieva

Using so called orbit charts, we have benchmarked companies on EBIT% versus Inventory Turns. That benchmark helped to reveal the ‘best practice frontier’, which in turn helped in setting aggressive but aligned targets for EBIT% versus Inventory Turns. Benchmarking EBITDA% versus Inventory Turns. It proves to be more resilient.

article thumbnail

The Coffee Pot Conversation That Will Not Happen

Supply Chain Shaman

Companies entered the pandemic with twenty more days of inventory than at the beginning of the great recession. A balance sheet analysis shows that 95% of publicly traded manufacturers are stuck (when compared to peer group) at the intersection of growth and margin, margin and inventory turns, and Return on Invested Capital (ROIC) and growth.

Gartner 197