article thumbnail

Embracing the Supply Chain as A Complex Non-linear System

Supply Chain Shaman

turns in 2013. Kellogg posted 19% margin in 2013 and 6.96 turns in 2013 but fell to 11% margin and 6.05 Orbit Charts for Kimberly-Clark and Kellogg for 2013-2022 A good friend of mine, asked, “Isn’t this the impact of the pandemic.” This work completed in 2013 defined the Supply Chains to Admire.

article thumbnail

Congrats to the Winners of the Supply Chains to Admire 2023

Supply Chain Shaman

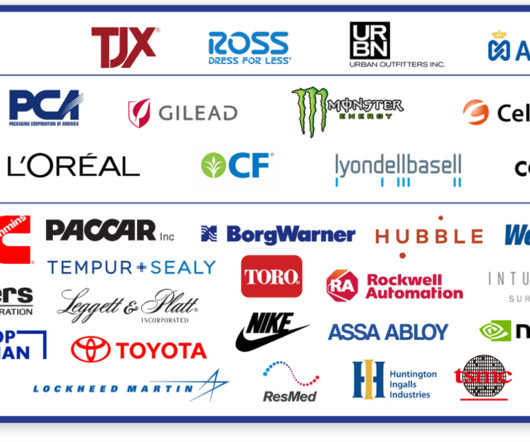
Nvidia, Northrup Grumman, PACCAR Inc, PCA (Packaging Corporation of America), ResMed, Rockwell Automation, Ross Stores, Taiwan Semiconductor Manufacturing (TSMC) Company, Tempur-Pedic, TJX, Toro, Toyota, West Pharma, United Tractors, and Urban Outfitters. The performance in 2022 is almost the same as that in 2013 (note the circular pattern).

Insiders

Sign Up for our Newsletter

This site is protected by reCAPTCHA and the Google Privacy Policy and Terms of Service apply.

article thumbnail

3 Core Metrics & 10 Soft Metrics for Measuring Supply Chain Performance

GlobalTranz

3 Key Metrics for Measuring Supply Chain Performance Beyond Cost Reduction. 10 Soft Metric Considerations in Measuring Supply Chain Performance. As of November 2013, there were 31 GPS satellites in operation. We are all in business to be successful and profitable, aren’t we? Read more. . Read More. . Read More. . Read More. .

article thumbnail

How We Stubbed Our Toe in The Evolution of S&OP

Supply Chain Shaman

Notice how the water turns from blue to brown in Figure 3 with the lack of demand translation capabilities within the enterprise for manufacturing and logistics. Organizations can align to drive value despite the allegiance to functional metrics. With the increase in complexity, manufacturing cycle inventories rise. Mistake #5.

S&OP 195
article thumbnail

This Week in Logistics News (July 15-19, 2013)

Talking Logistics

SAP Announces Second Quarter and First Half Results 2013. Here are some additional details from the press release: Data Services data sets will include mode-specific transportation costs and transit times, facilities cost estimates, demographics, risk metrics, duties and taxes, sustainability metrics and others.

article thumbnail

Metrics and Issues to Consider in SQM (Supplier Quality Management) By 5 Big Industries

GlobalTranz

In the first post our long tme guest blogger, Chuck Intrieri of The Lean Supply Chai n, gave us 5 core metrics to evaluate supplier performance using supplier quality management and a 4 step process to execute. Review of SQM Metrics and Issues Across 5 Core Industries. #1: Trend Metrics Collected per Site. Medical Devices.

article thumbnail

This Week in Logistics News (May 13-17, 2013)

Talking Logistics

Chainalytics Creates New Metrics for Demand Planning Consortium. Descartes’ GLN, route planning and transportation management solutions and deep domain expertise can help our retail, distribution and manufacturing customers in managing their global and local inbound logistics and delivery operations.”. . Be Sociable, Share!