article thumbnail

Supply Chain Performance Declined In the Last Decade. The Question is Why?

Supply Chain Shaman

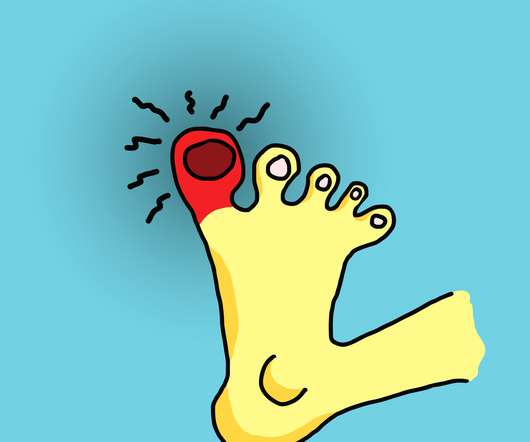
We stubbed our toe in supply chain management at the beginning of the decade. Facing The Issues of Supply Chain Performance. As I work through this year’s Supply Chains to Admire , I cannot help but shake my head. The black veil of the pandemic is a supply chain wake-up call to build better.

article thumbnail

Supply Chain Metrics - Gaining Visibility in a Data-rich World

Logility

The second part of Drucker’s quote, “if you can't measure it, you can't improve it,” really brings home the importance of having the right set of metrics. In the field of supply chain management, we have created an abundance of metrics and key performance indicators (KPIs). Accessibility.

Insiders

Sign Up for our Newsletter

This site is protected by reCAPTCHA and the Google Privacy Policy and Terms of Service apply.

article thumbnail

Supply Chains to Admire – Technology Computer Hardware Calculation Example

Supply Chain Insights

After doing a deep dive into the Household Products (Nondurable) industry segment to show why Proctor & Gamble did not make the Supply Chains to Admire TM winner list, I wanted to show an example calculation for a company that made the winner list. Supply Chains to Admire Methodology. Supply Chain Index Methodology.

article thumbnail

2016: Building a Balanced Scorecard for Discrete Industries

Supply Chain Shaman

2016 is around the corner. For the supply chain leader it is time to reflect and build budget targets. For each metric we show the averages and the percent change from the beginning and end of the period. Metric Performance for Discrete Industries. Supply chain leadership requires focus and leadership.

article thumbnail

Mining Supply Chain Data for Insights

Supply Chain Shaman

At Supply Chain Insights, we have been actively working in our own mine sweeping project. We loaded 493 financial metrics from balance sheets and income statements for each company into the data lake for the period of 2004-2016 using YCharts data. Does Supply Chain Planning Drive Value?

article thumbnail

2016: Building a Balanced Scorecard for Discrete Industries

Supply Chain Shaman

2016 is around the corner. For the supply chain leader, it is time to reflect and build budget targets. For each metric was show the averages and the percent change from the beginning and end of the period. Table 1: Metric Performance for Discrete Industries. Supply chain leadership requires focus and leadership.

article thumbnail

Announcing the Supply Chains to Admire 2017 Award Winners

Supply Chain Shaman

Supply chain excellence. The answer makes or breaks a supply chain leader’s career and defines corporate value. The first number in a cell represents the average value for a specific industry for 2010-2016, and the percentage on the second line is a comparison of the average for 2010 when compared to 2016.