Do you know how minimum orders, minimum production releases, and transfer batches affect your distribution network? As a supply chain professional, it’s essential to understand the impact of lot sizes on your inventory, lead times, and ability to deliver to your customers. In this article, we’ll explore how to visualize the impact and adapt to minimize the minimums. Who in your organization is the owner and accountable for this technical data?
What is the impact of lot sizes on your inventory, on your lead times, and on your ability to deliver to your customers?
A historical approach focused on total costs
Wilson’s formula has imprinted in our practices a notion of economic quantity. If we buy, manufacture, or transport less than X, it costs “too much”. It has been demonstrated over and over again that this Wilson formula makes no sense, and that it makes even less sense in the modern world, but the damage has been done, and this notion has remained imprinted in our subconscious. Your ERP system probably offers an economic quantity calculation based on this logic.
If you’re a buyer in industry or trading, chances are that minimum orders and the discounts they will allow are part of your negotiating arsenal.
Visualize the impact, and adapt
The Demand Driven approach, especially for inventory replenishment, facilitates visualization of the impact of minimums batches on inventory. The green zones of the replenishment loops allow you to judge the impact of minimum batches on inventory. By identifying green zones that represent a significant value and a significant number of days, you can begin to make adjustments to your flexible model to minimize the minimums.
We rarely see what impact minimum orders have on our inventory and flows.
Of course, we know that if the minimum is high, we will carry more inventory. We also know that if we are busy manufacturing a large quantity of something, the other products to be manufactured will wait… since we are busy. We also know that if we receive a container once a month, we will have more stock and less agility than if we receive goods every week.
We know all this. But how can we show the impact of this to induce decisions? How can we influence purchasing strategy if we can’t show the consequences? How can we convince production to increase the number of changeovers?
The Demand Driven approach, especially for inventory replenishment, facilitates this visualization. The green zones of the replenishment loops allow you to judge the impact of minimums batches on inventory.
Let’s look at some examples from real cases.
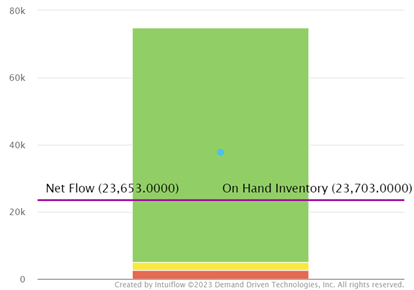
The green zone in the article below is based on a minimum order of 70,000 units, for an average consumption of less than 10 per day. The minimum order represents a value of 23k€ – and over 7000 days of consumption! These situations are obvious in the DDMRP model and alert to the need for adaptation.
/
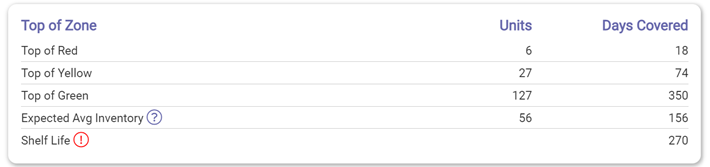
The example below concerns an item with shelf life: the minimum order implies a maximum stock level that exceeds shelf life, which implies that we will destroy part of what we buy…
Inventory modeling also makes it easy to measure the impact of minimum orders on induced investments.
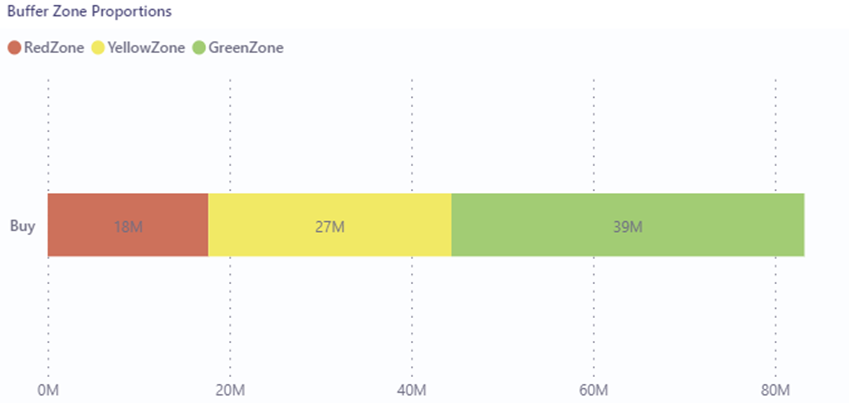
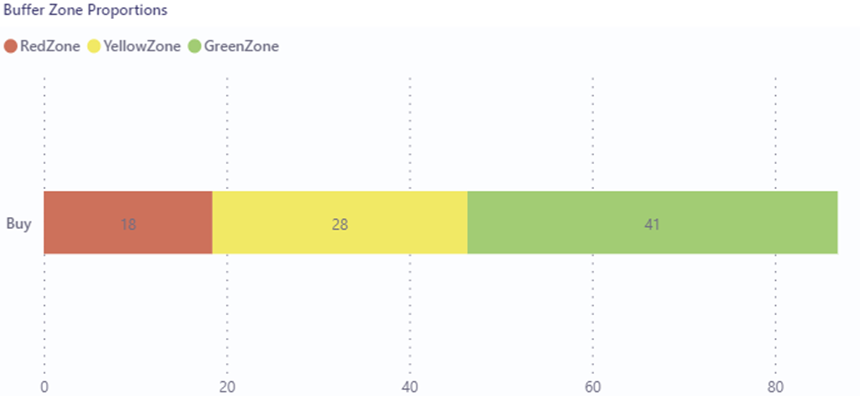
The graph below shows the structure of the replenishment model, all items included, of an end-to-end supply chain. All the replenishments of the supply chain of the company concerned are cadenced by green zones which represent a total of 39M€. The average impact on stocks will be half, approximately 19.5M.
If we measure this in days (below), the green zones represent 41 calendar days. This means that beyond the stock impact, on average it will take 41 days to sell a batch. More globally, between the safeties (red zone), the work-in-progress (yellow zone), and the batches (green zone), it takes on average more than 66 days for this supply chain, and up to more than 90 days, to adapt to the changes in demand.
Note: this is not bad, given the industry this company is in – let’s compare it with your own supply chain…
Visualizing minimum order levels, the risks they entail, and their impact on inventory costs and lead times enables a different kind of dialog with stakeholders – e.g. purchasing, production, suppliers, and customers. It is now a question of defining a flow model – a model to respond to market requirements – that is adapted to support business needs.
A minimum should be minimum!
Reducing lot sizes is one of the main levers to develop the agility of a supply chain. The first step is to visualize and correct the outliers: the lot sizes that represent a significant value and a significant number of days. This should be part of your monthly ritual of monitoring and adjusting your model.
In your supply chain model adaptation rituals, measure the impact of your green zones in value and number of days, and persevere to reduce them.
Of course, a pragmatic approach is required in order not to go too far – the notion of the lead time factor in a DDMRP model allows to position of a “reasonable” lot size threshold according to the flow of an item.
In short? Visualize and minimize your minimums!