


How to spot voids and protect ...
November 8, 2021
Data Scientist Justin Ziniel explains the methodology behind Crisp’s voids detection model, which helps brands monitor retail shelves with an algorithm tailored to their products’ sales.
Gaining distribution at a retailer is a big win for growing brands — but after working hard to secure that prized shelf space, they often discover that their work has only just begun. In a live retail environment, a number of things can happen that keep products from successfully making it onto (and off of) the shelves. We commonly refer to these as voids: a situation in which a product at a given store (also known as a point of distribution, or POD) should be available for customers to purchase, but isn’t. A void can occur for any number of reasons, including product being out-of-stock, off-shelf (i.e., all stock is in the back room), moved or placed in the wrong location, or expired or damaged.
For Crisp customers, identifying voids is an important task: there’s nothing worse than having consumers ready and willing to buy your product, but unable to find it. But knowing what is happening at thousands of stores across several different retailers in different regions at any given moment can be a monumental task for brands with limited time and resources. We decided to take on this challenge with data, and built a unique machine learning model that 75% of our customers are already using to spot and resolve voids. In this post, we’ll take a look under the hood to see how we made it happen.
At first glance, this problem of detecting voids in data doesn’t seem too difficult to solve. After all, can’t we just look at sales for a specific POD and decide that if it hasn’t sold recently, it’s a void? Unfortunately, it’s not so straightforward, for several reasons:
As a result, it takes sophisticated analysis to be able to identify what is actually a void. At the outset of our project, we decided that any successful voids model would need to:
With these criteria in mind, we began to look into possible solutions.
The first solution we explored was simple: if we know what a “normal” sales pattern looks like for a POD, we can treat abnormal sales patterns as likely voids. This model used just one input: how long has it been since the last sale?
For each POD, we looked at historical sales data to determine what constituted normal periods of “zero-sales.” We then ran a statistical hypothesis test to determine if a new zero-sales period was statistically larger than average (i.e., abnormal). If so, we labeled the POD as a void risk.
After trying out this model, we learned that while it met many of our requirements, it struggled with accuracy for a few reasons. For many PODs, we had very little historical data to work with, which made our statistics less robust. Additionally, we would need sales patterns that are statistically “well-behaved” for this model to work, with fairly predictable behavior. As those of us in retail know, that just isn’t the case: things change frequently and unpredictably all the time. Sales patterns also differ across products, some of which can quite normally go a long period of time without selling – and the model wouldn’t work as well on those products. So we decided to try another option.
Based on what we learned from Prototype 1, we next tried an approach that could take other factors into account beyond just the time since the last sale. We did this by building a classifier – a machine learning model that predicts a condition (e.g., VOID or NOT VOID) based on a collection of inputs. The inputs we fed into the model included short-term sales data, long-term historical sales data, geographic data, data from complementary products, and data from nearby stores – 13 distinct features in all!
This prototype was a major step forward: giving the model access to multiple inputs improved the performance noticeably. The model also learned over time, making it more accurate. For example, if a particular POD routinely goes three weeks without a sale, the classifier will eventually learn that this is normal and will not consider it a likely void. But if the POD at some point goes seven weeks without a sale, the classifier is likely to consider it a void risk since there are very few (if any) examples of the POD going seven weeks without a sale.
The classifier model can also take sales of other products from the same brand in the lineup into account, or sales of the same product at different store locations or retailers. This ability to aggregate data from other situations is what makes the model truly unique, and echoes Crisp’s philosophy behind data sharing: the more data that’s available to brands and retailers, the better they can understand the market and serve shoppers.
While we couldn’t manually check our model at each store, we did visit a few locations to validate predictions. In one memorable example, I was walking around a store looking for a particular pickle product that our model said was a likely void. Unable to locate the product’s shelf slot, I was about to give up when I decided to peek behind a temporary cardboard display that had been set up in the aisle. There was our pickle, but there was no way shoppers were ever going to find it – something our model picked up on!
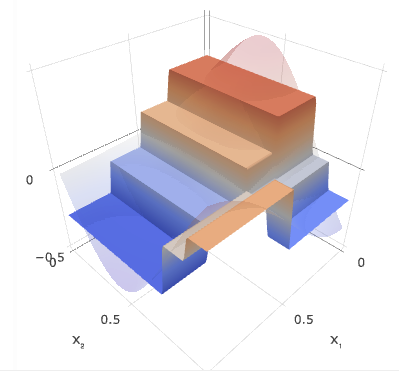
We decided to use the classifier model (Prototype 2) for our final product, relying on a technique known as a gradient boosted tree. This technique can fit very complicated shapes (“decision surfaces”) to the data, as shown in the figure below. The flexibility of the gradient boosted tree model allows us to fit unique decision surfaces for each brand, essentially giving every customer its own customized model!
While we enjoy explaining the data science behind void detection, you don’t need to be data savvy to take advantage of it. Crisp’s Voids Dashboard helps you track trends in voids, drill down by locations or products, and export store lists with just a few clicks. To learn more about using the Voids Dashboard, read our previous blog post. To learn more about how Crisp can help your brand with retail insights, contact us today for a demo.
* Required
We will handle your contact details in line with our Privacy Policy.
Crisp uses the power of the cloud to connect and analyze all of your data sources in real-time, providing you with the most meaningful insights and trends for your business. When you know exactly what’s in store, you can keep shelves stocked and customers happy while skyrocketing profitability.
 |
 |
 |
|
 |