Remove Austria Remove Europe Remove Japan Remove Malaysia
article thumbnail

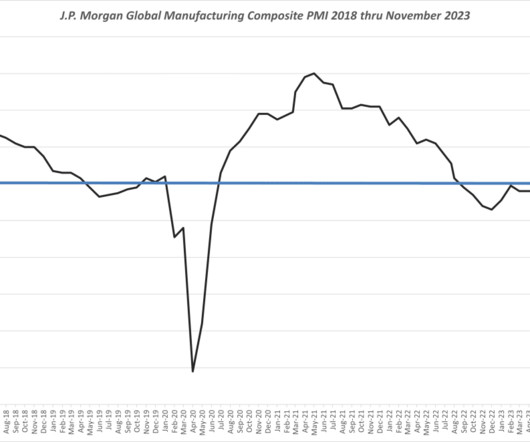
November Global PMI Reporting Reflects Some Stabilization

Supply Chain Matters

On a regional basis, Europe reportedly remained a principal drag on global factory output, along with contracting output in Japan and the United Kingdom. Austria was indicated as the worst performer, followed by Germany and France. Commenting on the November data, Bennett Parrish, Global Economist at J.P. reflecting a 1.1

article thumbnail

Global PMI Levels in July Remain of Concern

Supply Chain Matters

Further indicated were signs of weakness occurring in China , Japan , Malaysia, South Korea , Taiwan and Vietnam. Considerable weakness was noted for both Germany (a 38 month low) and Austria (a 39 month low) in July, both reporting the lowest PMI values in this sector.

Insiders

Sign Up for our Newsletter

This site is protected by reCAPTCHA and the Google Privacy Policy and Terms of Service apply.

article thumbnail

Global Wide Production PMI Levels Unchanged in February 2024

Supply Chain Matters

Output reportedly rose in China, India, Brazil and the United States , while declines continued in the Eurozone , Japan and the United Kingdom. India again led all other regions, while Germany and Austria remain at highest levels of PMI contractionary levels. in February compared to 50.3 in January, and 49.7

article thumbnail

SCM Map Europe: European location decisions remain complex

Supply Chain Movement

Supply chains in Europe are facing a wide variety of changes. For the fourth consecutive year, Supply Chain Media has produced the SCM Map of Europe providing an overview of the most relevant data for value chains. The most important urban corridor in Europe is the so-called ‘Blue Banana’ totalling 111 million inhabitants.

Europe 60
article thumbnail

Download now: 3PL Subway Map Europe 2016

Supply Chain Movement

Fourth release of 3PL Subway Map Europe. these are the main conclusions from Supply Chain Movement’s annual study as the basis for the 3pl subway map europe 2016, which shows the specific services of the most important logistics service providers. 3PL Subway Map Europe 2016. By Martijn Lofvers. >>Please Choose country.

Europe 60
article thumbnail

Most desirable logistics location of Europe in 2018

Supply Chain Movement

Venlo Logistics Map Europe 2016. . >>Please click on the red button and fill in the fields to activate the green download button. Please fill in the following fields to activate the download button. Choose country. Afghanistan. Ã…land Islands. American Samoa. Antarctica. Antigua and Barbuda. Azerbaijan. Bangladesh. Kazakhstan.

article thumbnail

FedEx Announces New March 2022 International Shipping Surcharges

Intelligent Audit

Parcel and freight exports from Macau SAR, China to Europe, MEISA, some LAC countries 1 , and some APAC countries and territories 2 – Increasing $0.25 Parcel and freight exports from Japan to Europe, MEISA, LAC 4 – Increasing $0.10 Europe Outbound International Shipping Surcharges. from Europe 14 –Increasing $0.05