Remove Austria Remove Europe Remove Malaysia Remove Supply Chain
article thumbnail

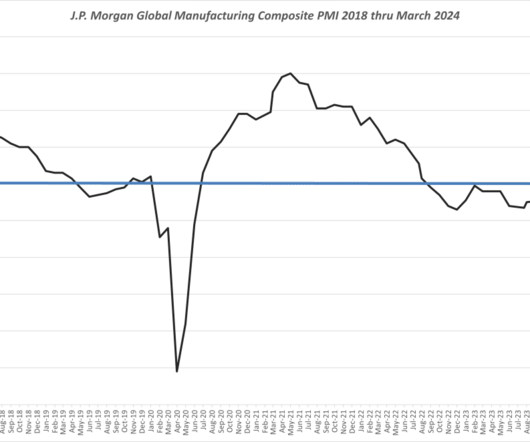
Global Wide Manufacturing Output Strengthens in March 2024

Supply Chain Matters

Supply Chain Matters provides readers a further installment in our global supply chain assessment series in providing highlights on reported March 2024, and Q1-2024 global and regional production and supply chain PMI indices. Morgan Global Manufacturing PMIĀ® ended March on an optimistic footing.

article thumbnail

Global PMI Levels in July Remain of Concern

Supply Chain Matters

Supply Chain Matters provides highlights and perspectives on reported July 2023 global and regional production and supply chain PMI indices. Further indicated were signs of weakness occurring in China , Japan , Malaysia, South Korea , Taiwan and Vietnam. percentage points higher than the 46 value reported for June.

Insiders

Sign Up for our Newsletter

This site is protected by reCAPTCHA and the Google Privacy Policy and Terms of Service apply.

article thumbnail

November Global PMI Reporting Reflects Some Stabilization

Supply Chain Matters

Supply Chain Matters provides a further global supply chain assessment in the highlights and added insights on reported November 2023 global and regional production and supply chain PMI indices. Austria was indicated as the worst performer, followed by Germany and France. reflecting a 1.1

article thumbnail

Global Wide Production PMI Levels Unchanged in February 2024

Supply Chain Matters

Supply Chain Matters provides highlights of reported February 2024 global and regional production and supply chain PMI indices. India again led all other regions, while Germany and Austria remain at highest levels of PMI contractionary levels. in February compared to 50.3 in January, and 49.7

article thumbnail

SCM Map Europe: European location decisions remain complex

Supply Chain Movement

Supply chains in Europe are facing a wide variety of changes. To arrive at optimal European supply chains it is crucial to consider shifts in economic growth, currency fluctuations and tax reductions in addition to production and distribution costs. By Martijn Lofvers. Key sales market.

Europe 60
article thumbnail

Download now: 3PL Subway Map Europe 2016

Supply Chain Movement

Fourth release of 3PL Subway Map Europe. these are the main conclusions from Supply Chain Movementā€™s annual study as the basis for the 3pl subway map europe 2016, which shows the specific services of the most important logistics service providers. 3PL Subway Map Europe 2016. By Martijn Lofvers. >>Please

Europe 60
article thumbnail

Most desirable logistics location of Europe in 2018

Supply Chain Movement

It ranked the Dutch city of Venlo as Europeā€™s most attractive location for a logistics base. Supply Chain Media and Smart Logistics Centre Venlo have created a map which visualizes the position of Venlo in one overview. >>Please Venlo Logistics Map Europe 2016. Choose country. Afghanistan. ƅland Islands.