Building Muscle for Waste Awareness
It almost seemed hackneyed: Lean manufacturing and continuous process improvement. The phrase is tossed about with a certain familiarity and forgone conclusion. Yet this intentional, ongoing process of improving services, and procedures to improve flow, customer satisfaction, quality, safety, and profit means nothing without metrics. A systematic process which identifies and eliminates waste so that ongoing, measurable gains are routinely achieved can only be quantified when the current state and future state are measured.
Like building muscle sensing, identifying, and being aware of waste is a process. Lean manufacturing teams convert vision statements into specific, actionable measures. Strategies are devised to guide future actions for achieving desired results. I will point to some specific, actionable metrics that can help guide these efforts in a moment, but first let’s review some of the reporting and trending tools used by Lean teams to review process improvement efforts.
Metrics Reporting System
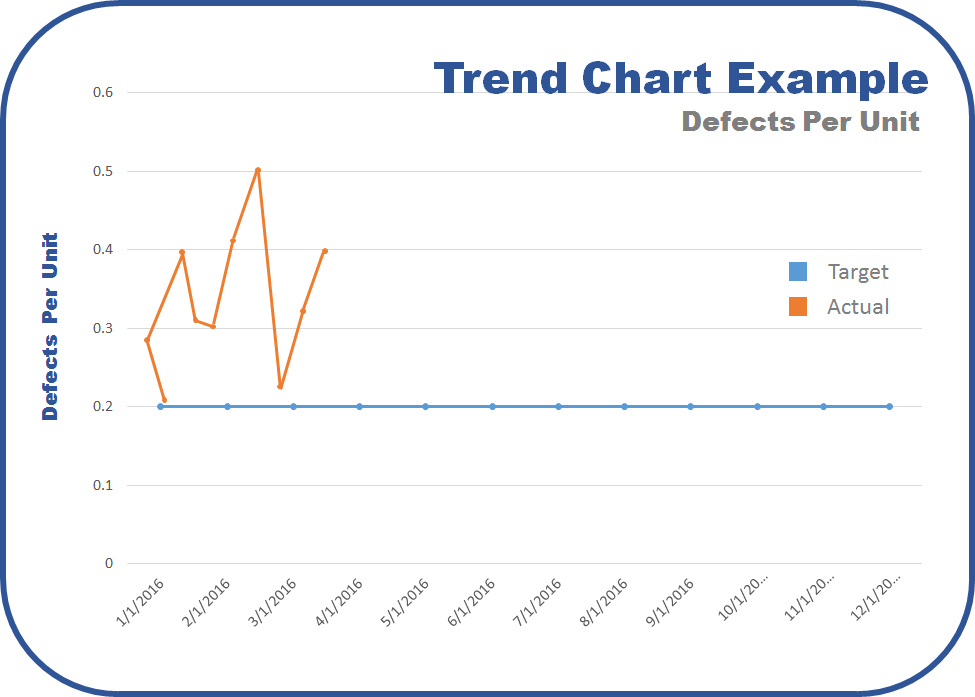
Whether required by the CFO to prove fiscal value, or Quality Assurance to attest to improved quality and lower failure rates, all members of a Lean manufacturing operation must demonstrate performance changes over time and compare performance to targets. This is often expressed as a trend chart.
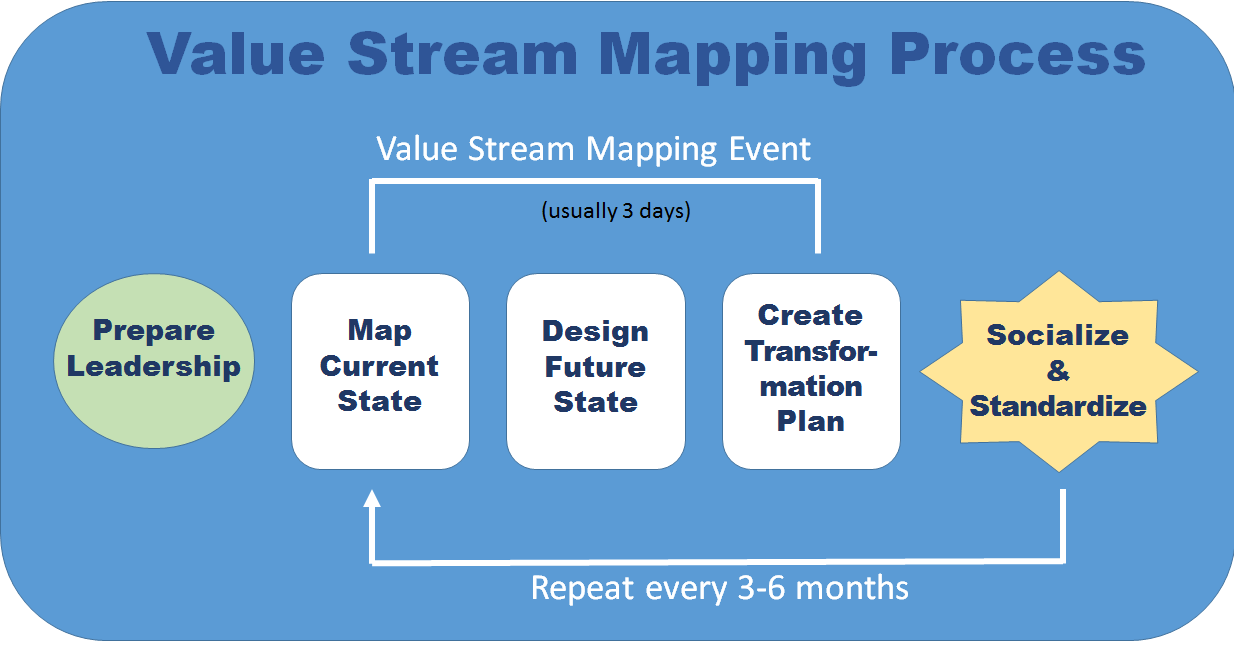
Before looking at those trends, working through a comprehensive Value Stream Map (VSM) of the process will clearly illustrate current issues and their relative severity.
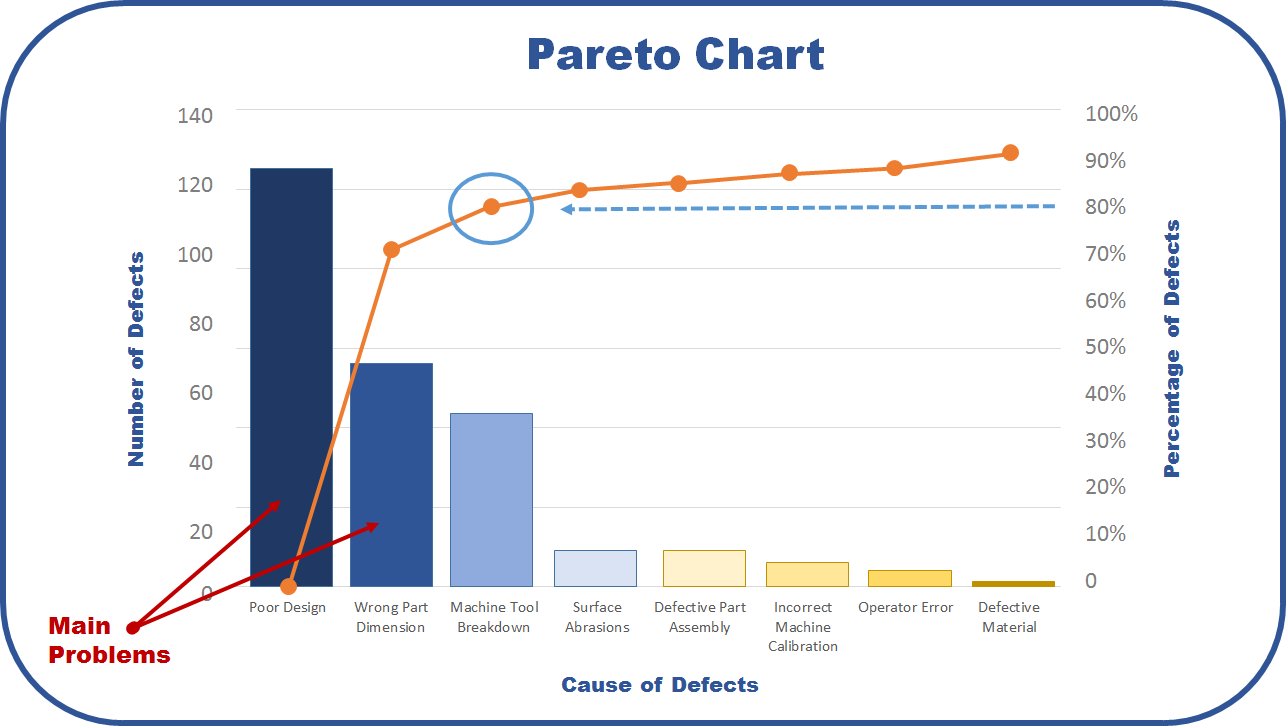
One of the first outcomes of the VSM is often expressed as a Pareto Chart. In the graph below, the bars represent frequency or cost (time or money), and are arranged with longest bars on the left and the shortest to the right. The chart visually depicts which situations are more significant.
Past is prologue. The phrase comes from Shakespeare’s play The Tempest, where Antonio is trying to convince Sebastian to murder his sleeping father so that Sebastian can be king. His use of the phrase is intended to say to Sebastian that their lives up to this point — their past — was merely a prologue — an introduction — to the great story that they will soon embark upon if they go through with this plan. Used this way, it is meant to imply that everything that came before does not matter because a new and glorious future is ahead.
Unfortunately, like a lot of phrases coined by Shakespeare, it has since taken on the exact opposite meaning. The way it is commonly used today suggests the past is of great importance because it defines the present and therefore sets the stage for the future. It is in this sense used very similarly to “those who fail to learn the lessons of history are doomed to repeat them.”
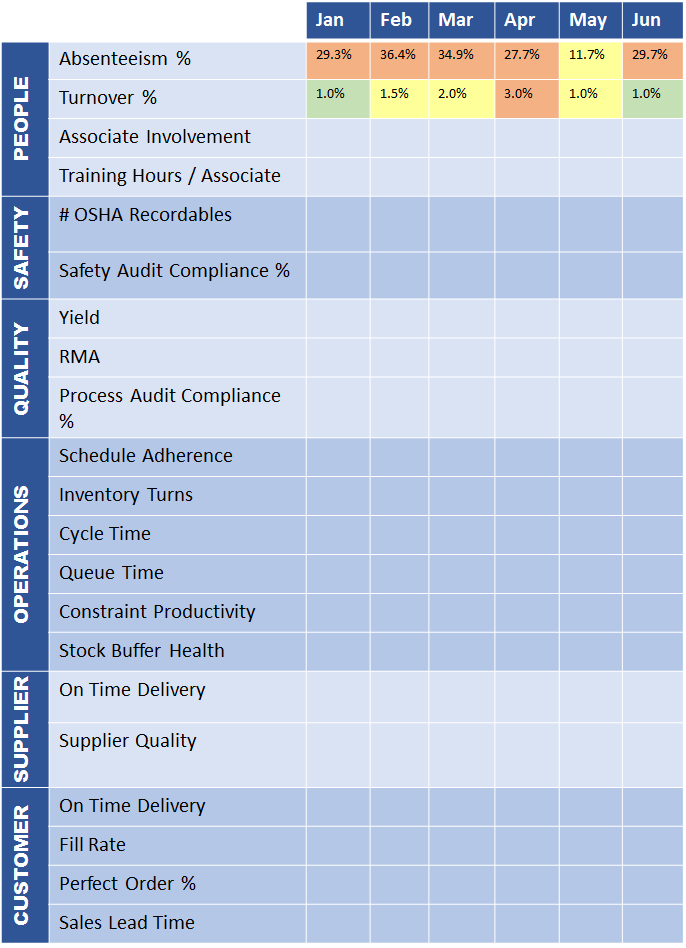
The measurement tool in Lean manufacturing that shows historical trends about waste issues and the relative severity of past issues can be expressed as a Paynter Matrix (example above). It is a matrix of problems, faults, failure types vs. occurrence frequency (days / weeks / months) – named after Marvin Paynter of the Ford Motor Company.
Improvement must result in a corrective action. Lean manufacturing best-practices require an Action Log (example below), which records actions that have been taken and report the effectiveness of those actions. Monitoring actionable metrics can not only provide the right data points for the Action Log, but can facilitate measurable movement in the right direction.
Metrics that Drive Action
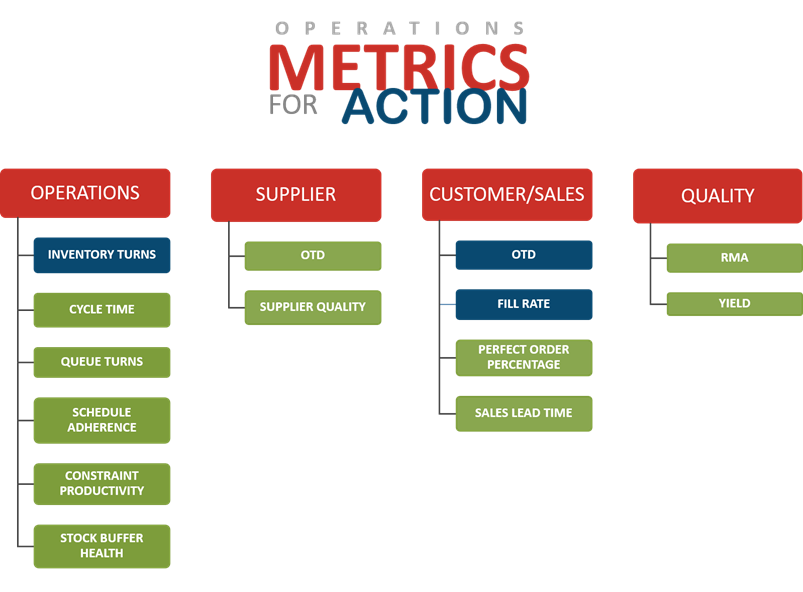
At the beginning of this post, I mentioned that Lean teams convert vision statements into specific, actionable measures – and that they devise strategies to guide future actions for achieving desired results. The Demand-Driven Manufacturing Metrics for Action are those actionable measures. They are a proven system of metrics developed based on decades of working with manufacturers on Lean and continuous improvement initiatives. The Metrics for Action are a streamlined set of operational metrics to monitor – and that you can take immediate action on to improve. (They can also identify areas for continuous improvement.)
The white paper, Demand-Driven Manufacturing Metrics that Drive Action, describes the foundation for these metrics and the Metrics for Action Guide describes each metric, how to measure it, and provides suggested actions for improvement.
If you have used these metrics, please share any insight – or value – they provided in your organization.