
Cleaning up demand histories is a classic discipline for any forecaster in the supply chain. When generating a statistical forecast, you must first ensure that the historical data has been cleaned of outliers. Otherwise, beware of GIGO! (Garbage In, Garbage Out).
This historical clean-up is generally carried out on monthly buckets, sometimes on weekly buckets. It is often used to establish forecasts, omitting other side effects of a raw history.
For example, the history is cleaned up so that the statistical forecasting module doesn’t go astray, but in a dark corner of the ERP system, a statistical safety stock formula is used, which uses all historical consumption, including outliers…
Clean data is also a prerequisite for running artificial intelligence algorithms. This is known as “data cleansing”.
Let’s look at the impact of an uncleaned history on a simple example.
We select a part on which we have detected three outliers.
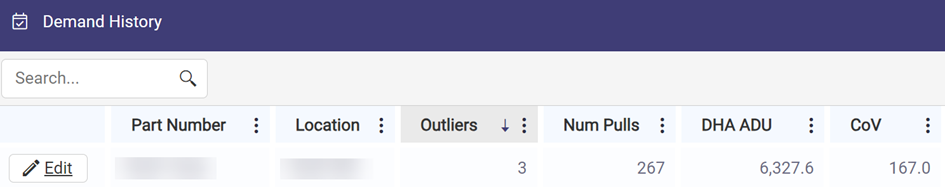
This item is used very frequently – we had 267 days of consumption in the past year.
Let’s take a closer look at this application history… do you see these three outliers?
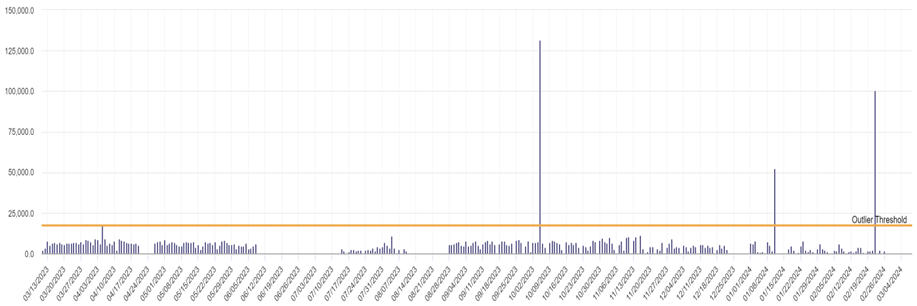
Have you also noticed that instead of exploring an aggregated monthly or weekly view, we explore daily consumption? If you want to correctly size a stock, for example, it’s these daily demands that count – rather than averages that mask the reality of real demand signals.
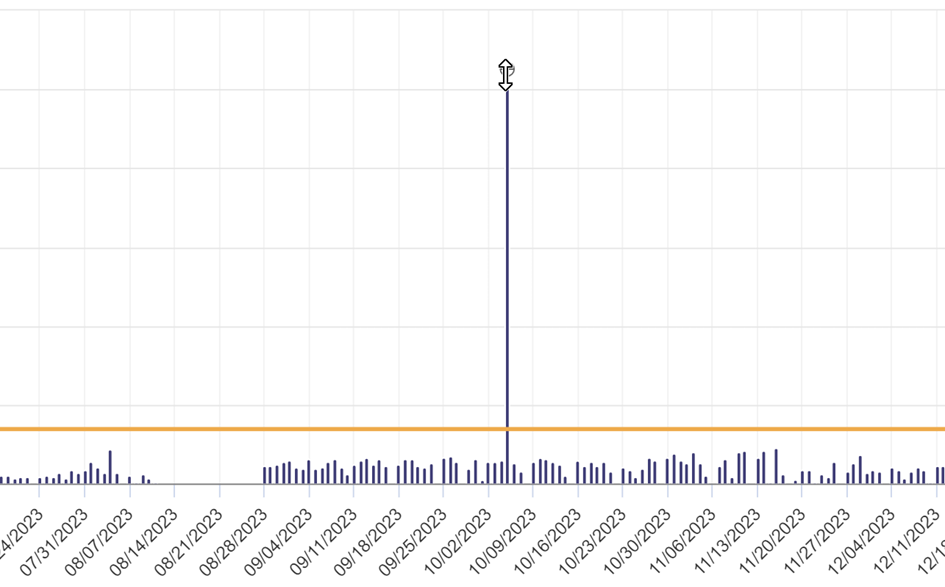
We’ll adjust each of these outliers downwards with a simple drag & drop:
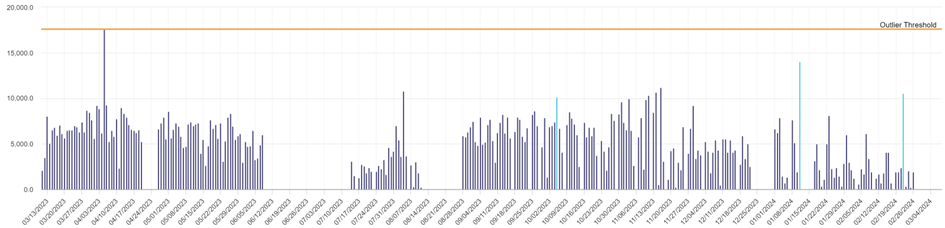
That’s more reasonable:
I hear objections from the back of the room: this is no longer the real demand!
That’s right, it’s a demand corrected for points that seemed statistically outliers. The question is: should you size the stock of this item to meet all actual demand with immediate availability, or should you meet recurrent demand from stock and adopt another tactic for exceptional requests, such as “dear customer, this is an exceptional request, please let us know in advance, there is a slight delay…”?
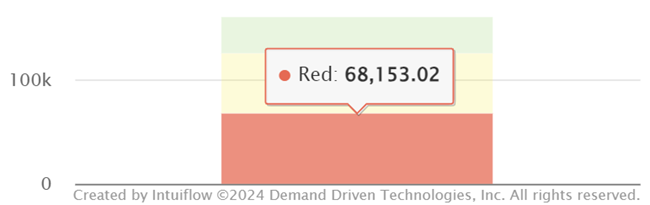
Let’s see the impact of this article:
Before the historical correction, the red zone was 68,150
After correction :
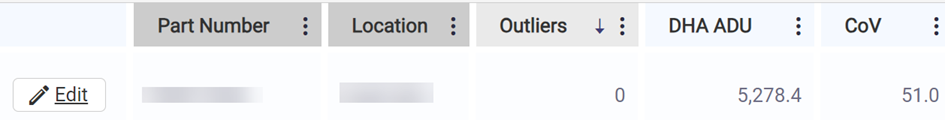
- No more outliers (they’ve been corrected)
- Average daily consumption fell from 6327 to 5278 (-17%).
- The CoV – coefficient of variability (standard deviation / average daily demand) has collapsed from 167 to 51: we now recognize that this article is very stable.
- The red zone has fallen to 42,600
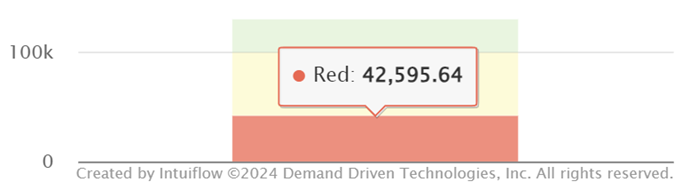
A little sweep of the data history, and our stock investment to achieve roughly the same service level drops by around 35%, so it’s worth doing a bit of housekeeping, isn’t it?
Cleaning up historical amounts of data, and detecting and interpreting outliers is an important discipline that deserves to be equipped with proper tooling to:
– Detect items requiring analysis.
– Determine a suitable cleaning process: automatic, or with the intervention of human intelligence to understand the nature of outliers, and the appropriate response tactics.
– Adequately reflect the impact of cleaning on stock sizing, forecasting, spike detection mechanism, delivery promise process, etc.
If you’d like to explore the subject further using your data, please don’t hesitate to contact us!