Summary
Whether it is COVID-19 or any aspect of supply chain management, effective organizational performance requires the combination of data analytics and modeling mixed with reasoning from the first principles. With data alone, it is impossible to anticipate the future or understand the impact of actions. Models drive a new way of thinking to solve the mystery. This blog demonstrates how a simple binomial model can help anticipate the future including COVID-19 breakthrough cases, just as models help a firm estimate its future.
Introduction
In May 2020 there was a growing consensus COVID-19 was on the run. This assessment was based only on data analytics and did not involve modeling. Recent events in the COVID-19 struggle, for example, the July 2021 Provincetown infection surge, have made clear breakthrough cases (a person fully vaccinated for COVID-19 can get and spread COVID-19) can and will happen. This possible scenario was noted early in the vaccination process, even by the CDC, but was ignored due to a data-only focus. Which raises the question: why did the CDC reduce data collection efforts on this possibility?
[cta id=’4922′]
In reading the reports over the last week, it is clear COVID-19 leaders were surprised by the breakthrough cases, clinging to the May 2020 view COVID-19 was on the run. In fact, the application of a simple and well-known supply chain of models to augment data makes clear breakthrough cases will occur and details the circumstances in which they will flourish. This blog has two purposes: (1) outline how the two-penny model enables anyone to anticipate the breakthroughs and avoid being in reaction mode and (2) by extension show the importance of supply chain management by making use of models to augment data analytics. The importance of using models that can match the complexity of the application area is a key point in an upcoming webinar on optimization for central planning.
What is the Two-Penny Model?
An important area of SCM is assessing the capacity of a factory in detail. One critical question in many factories (including wafer fabrication) is tool availability. For example, if my manufacturing process has two identical tools available to handle the workload, on any given day what is the probability of having the number of tools available to be: 0, 1, or 2. This is like the question if I flip two coins the probability of each combination is shown in Table 1.

If the probability of one head is 50% and one tail is 50%, then the probability of two tails is 50% x 50% = 25%. The probability of two heads is also 25%. The remainder is 50% for one head and one tail.
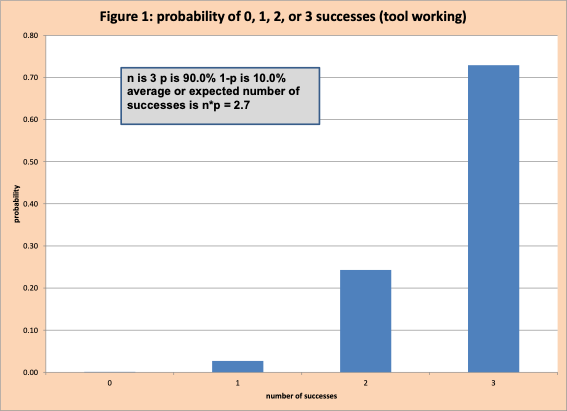
What if we have three tools and the probability of a tool being available is 90%. The possible combinations of working and not working are given in table 2.

How do we find the probabilities? What is the probability the number of tools working is 2 and the number not working is 1? We use the binomial model. The players in the game for this model are:
- N – number of tools, 3 in this example
- Success – definition of success, in this example a tool is working
- P – probability of individual success, in this example 90% probability
- S – number of successes, 2 in this example
- PS – probability of S success, the answer we need
Table 3 shows this calculation in Excel. PS for 2 is 24.3%.

Figure 1 is a graph with the probability of each number of successes.
The Binomial and COVID-19 Spread
How does this help understand breakthrough cases? Assume the probability the vaccine is effective in keeping a person from getting infected with COVID-19 is 90%. How the 90% value is determined and the mechanics/science motivates the immune system are separate questions.
The 90% implies 10% of the time the vaccine does not generate effective protection. If this was landing an airplane, 1 in 10 planes would crash on landing. For this analysis we will make the simplification of dividing those who have been vaccinated into two groups:
- 90% group – if exposed to COVID-19 the virus does not have success in setting up camp in the body, replicating, and attempting to spread to others.
- 10% group: if exposed, COVID-19 is successful in setting up camp.
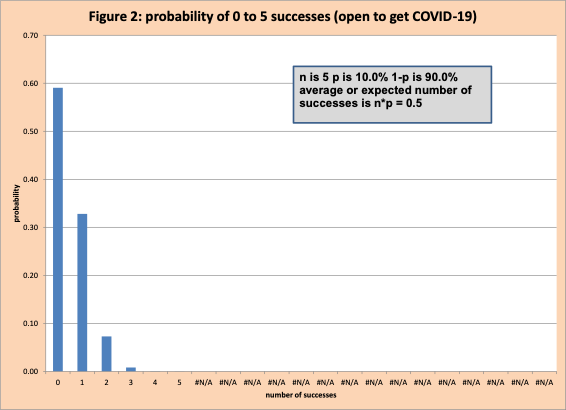
Success is defined (without moral judgment) as being unable to ward off COVID-19. PS is 10%. If we have 5 people in a room, all of which are vaccinated, the binomial model can tell us the probability that 0 can be infected, 1, 2, 3, 4, or 5. Figure 2 has these values. There is a 35% chance that 1 or 2 people in this vaccinated group could be infected. Something to think about the next time your boss decides an in-person meeting is better than a Teams meeting. Of course, the only way an at-risk person can get COVID-19 is if there is a vector into the room and they decide to breathe.
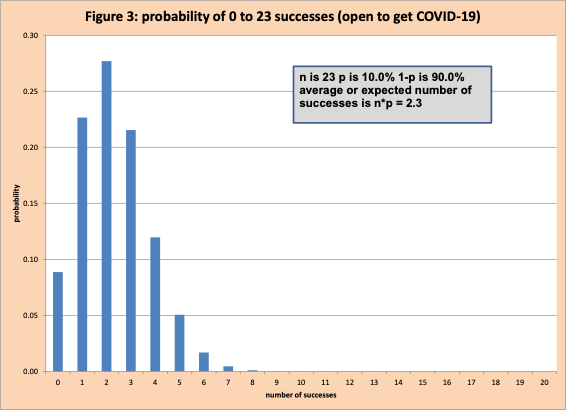
What about a group of size 23? Figure 3 shows there is a very good chance between 1 and 4 people in this group of 23 could be infected.
What about a group of 200? The average number of people who are at risk is 20 (=200x 10%). There is a 98% chance between 10 and 30 people in this group who could easily be infected if there was a COVID-19 vector into the group.
Finishing the Analysis – Simulation
Using Monte Carlo simulation methods we can easily simulate the flow of people and fun times similar to Provincetown, MA to estimate risk. It is outside the scope of this blog to cover this simulation in detail, briefly.
Assume the vaccine works 90% of the time and fails 10% of the time. If 200 people fit into a space that holds 100 with a partying atmosphere (more loud talking driving virus particles into the air) and no masks. Assume all 200 are vaccinated – leaving 15 to 30 vulnerable. If there is COVD-19 (probably Delta variant) in, then 10 people out of the 200 become infected. These 10 leave this party and go to other crowded parties – where additional people are infected. The multiplier effect. In a short time, you have 300 infected people, six of which are in the hospital.
Conclusion
Whether it is COVID-19 or any aspect of supply chain management effective organizational performance requires the combination of data analytics and modeling mixed with community intelligence. With data alone, it is impossible to anticipate the future or understand the impact of actions. This blog demonstrates how a simple binomial model can help anticipate the future much better than a trend graph. As in SCM, COVID-19 remains an ongoing mystery that requires data, models, and reasoning from first principles.
Enjoyed this post? Subscribe or follow Arkieva on Linkedin, Twitter, and Facebook for blog updates.