1. Define your North Star

The supply chain has never been a simple beast to tame. This is especially true for brands today that need to battle more complicated supply chains and greater expectations from their retailers. Each retailer has its own unique set of standards and procedures that need to be incorporated by the brand into its own set of operations.
One challenge — and opportunity — is the fact that data is being captured along every node of the supply chain. If you can harness the data, you can put it to use to improve your business!
With that being said, choosing to harness data isn’t as simple as accepting that data is beneficial. Deciding to embark on a quest to attain retail analytics capabilities is only the first step. This is a pitfall that we see many well-intentioned sales, supply chain and retail account professionals fall into. They know that the data to improve their efficiency and bottom lines is out there, but simply throwing money at a solution or tasking the IT department to build some reports won’t advance them to their goals. This is because they haven’t defined their North Star before beginning an RFP process.
It’s for this reason that we decided to put together this guide. Our aim is to help you articulate what you need from a retail analytics solution before diving headlong into your project. By first defining the objective you’re seeking, you will have a better chance of finding and implementing the right retail data pipeline for your business.
2. State of retail analytics
Harnessing retail data and putting it to work for the brand is a newer concept in the industry. Only since the mid-2000s have people been talking about Big Data, let alone developing real processes to turn complex data streams into usable outputs. The fact that historically retail data has been inaccessible to brands since it lives outside of their “walls” is also a contributing factor. There isn’t a one-size-fits-all solution and the technical complexity has meant that innumerable methods of collecting and analyzing retail data exist today.
However, retail buyers expect brands to come to them with data-backed recommendations. The reason a lot of retailers have made POS data available to brands is because of the increasing margin pressure and competitive landscape that retailers face, so a brand that is harnessing the full power of the data the retailer makes available to them is the one that builds the highest level of trust with their retail buyer. Below is a breakdown of the most common approaches to gaining sales and supply chain insights from retail data from least to most automatic.
Manual reporting
Manual reporting is, unfortunately, the method all too many brands still leverage to operate their business. Perhaps even more worryingly, the larger the enterprise, the higher the chance that at least some areas of the business still rely on spreadsheets to monitor and evaluate their retail data. Unfortunately, manual reporting takes some companies so much time that even when insights are found, they’re either too late or there isn’t enough time left over to react.
This homegrown method might have started at a manageable level of work but has likely grown to a point where value is being left behind simply because of time constraints. In addition to it being nearly impossible to harmonize data from all sources within a single spreadsheet, keeping these up to date is so manually intensive that many organizations choose simply to forego insights they intuitively know could add value. This method is also prone to data errors made by oversights and mistakes.
Manually downloading tables of data into spreadsheets and applying formulas and macros isn’t necessarily the wrong choice for all companies. For instance, those brands with only a couple SKUs in a single retailer or e-commerce store may find that manually reporting is worth the time and effort. The fewer the data streams, especially if those data streams are already “speaking the same language”, the less manual work needed to extract insights on metrics like sales performance and on-shelf availability.
BI tool + data lake
Leveraging a BI tool with a data lake is often the first step organizations take to move away from manual reporting and closer to automation. Common BI tools used include Tableau, Power BI, Looker and Domo. These tools are often used by the same person who would have done (or does) the manual reporting in spreadsheets. This is often a retail account manager or a dedicated analyst. Licenses are often individual and may silo user access and capabilities. For companies that want their analytics to be entirely self-service, however, this could be the answer.
The user can upload flat files or set up connectors to help centralize data from connectable portals, though data storage is limited. IT departments may be tasked with building KPI dashboards and one-off reports that require knowledge of SQL or programming languages.
Another downside of BI tools is that they have a very narrow focus where the user can analyze only a single retailer at a time. It is very challenging to combine data to build a cross-retailer view to truly understand the business since each retailer provides data in a different format. Additionally, it is very painful for a brand to attempt to complete historical (YoY) analyses because data ranges provided by retailers are static unless the user seeks IT support. This lack of harmonization is a time-intensive challenge to fix manually.
Though opting for a BI tool with a data lake makes it faster to get answers to routine questions, it still requires significant manual intervention to dive into the data. Unfortunately, more executional or granular use cases, such as quantifying lost sales, detecting phantom inventory and projecting sales and inventory is impossible in BI tools. For brands with the cycles and know-how to create their own formulas and automated processes though, this method may be enough for the less complex company.
Generic POS analytics point solutions
POS analytics point solutions come one step closer to compiling retail data into a single, usable format for brands. These solutions often have a single portal that can act as a central repository for all sales and inventory reporting, dashboards with one-click drill-downs, and pre-built templates for retail execution all hosted in the cloud for easy access.
The main differentiating features between a built-out custom BI tool and a POS analytics point solution is that point-of-sale data is being fed directly into the portal and that these solutions have purpose-built data models which are specific to POS data. This means brands can see what is happening from the retailers’ point of view in near real time, and some use cases that are difficult to impossible to build in BI are out of the box.
The biggest downside of a generic POS analytics point solution is that the data is siloed to only POS data. This means that once an issue is identified at the point of sale, it is a challenge to react to it. The user needs to find a way to collaborate with other people within the organization to see what is possible to do to rectify the problem. The lack of ERP data residing and usable within the same solution makes it hard to execute changes.
When assessing this type of technology, be aware that many platforms are built and designed for retailers, not for companies selling products. Additionally, watch out for platforms that specialize in other forms of technology such as transportation management or financial services which have a retail analytics function as a secondary feature.
Some examples of SaaS POS analytics point solutions that brands leverage include SPS Commerce Analytics, RSi, E2open and Accelerated Analytics. Each has its own set of capabilities and specialties.
POS analytics point solutions built for consumer brands
The final method of extracting insights from retail data comes in the form of POS analytics point solutions that have been built specifically for consumer brands. These SaaS platforms, like Alloy itself, offer full network visibility from plant to store. During implementation, retailer data including POS, as well as ERP, e-commerce, 3PL, distributor and myriad other data streams are connected so that data within the platform is automatically up-to-date.
Since the data model supports not only traditional POS metrics, but also allows for network-aware analysis (i.e., upstream units on hand or downstream lost sales), these solutions come standard with pre-made reports and dashboards tailored to the needs of brands selling in retailers like Walmart, Target, Amazon, McLane, C&S Wholesale Grocers, Shopify and Walgreens (to name a few). Data is harmonized automatically across retailers, distribution centers, regions and SKUs.
Any user, whether or not they have an IT or analytics background can customize a report and quickly extract the insights they need. This type of solution is ideal for consumer brand companies that sell numerous SKUs in a variety of retailers, all with their own S&OP processes. POS analytics point solutions that have been built with
consumer brands in mind can flexibly pivot between the needs of sales, trade marketing, merchandising, analytics, planning, operations and C-Suite teams within a single platform. This means that everyone is always working off of the same, real-time data.
3. Visualizing your data streams
Before progressing further, take a minute to think about all of the data that you have access to. Do you use it today? Where is it coming from? Use this worksheet to brainstorm where your data is living now and where you’re getting it from. Remember to think about your ERP, e-commerce, data lakes, 3PLs, direct imports, forecasting systems, and anywhere else data may be stored.
Download the PDF version of this guide to view an example and complete your worksheet.
4. Visualizing your current processes
Now that you have a sense of where your data is flowing from, think about your current processes for using the data. Later we will identify gaps where your data could help with additional business outcomes. For now, let’s focus on the current state. Think about the following examples and departments. Feel free to add your own as each brand is unique.
Examples of how data might be being used today:
- Monitoring sales
- Tracking in-store execution (phantom inventory, on-shelf availability, out-of-stocks)
- Monitoring KPIs and SLAs
- Measuring events, promos and item launches/ discontinuations
- In-store execution
- Tracking trends and seasonality
- Demand forecasting and inventory planning
- Line reviews and recommendations to buyers
- Allocation decision-making
Download the PDF version of this guide to view an example and complete your worksheet.
5. Considerations when buying a retail analytics solution
Now that we’ve considered how your retail data flows, as well as your current processes, it’s time to find your North Star. Each brand will have different goals in mind when buying a retail analytics solution. To help you determine your potential goals, we’ve outlined several use cases other brands have highlighted as important when going through this buying process.
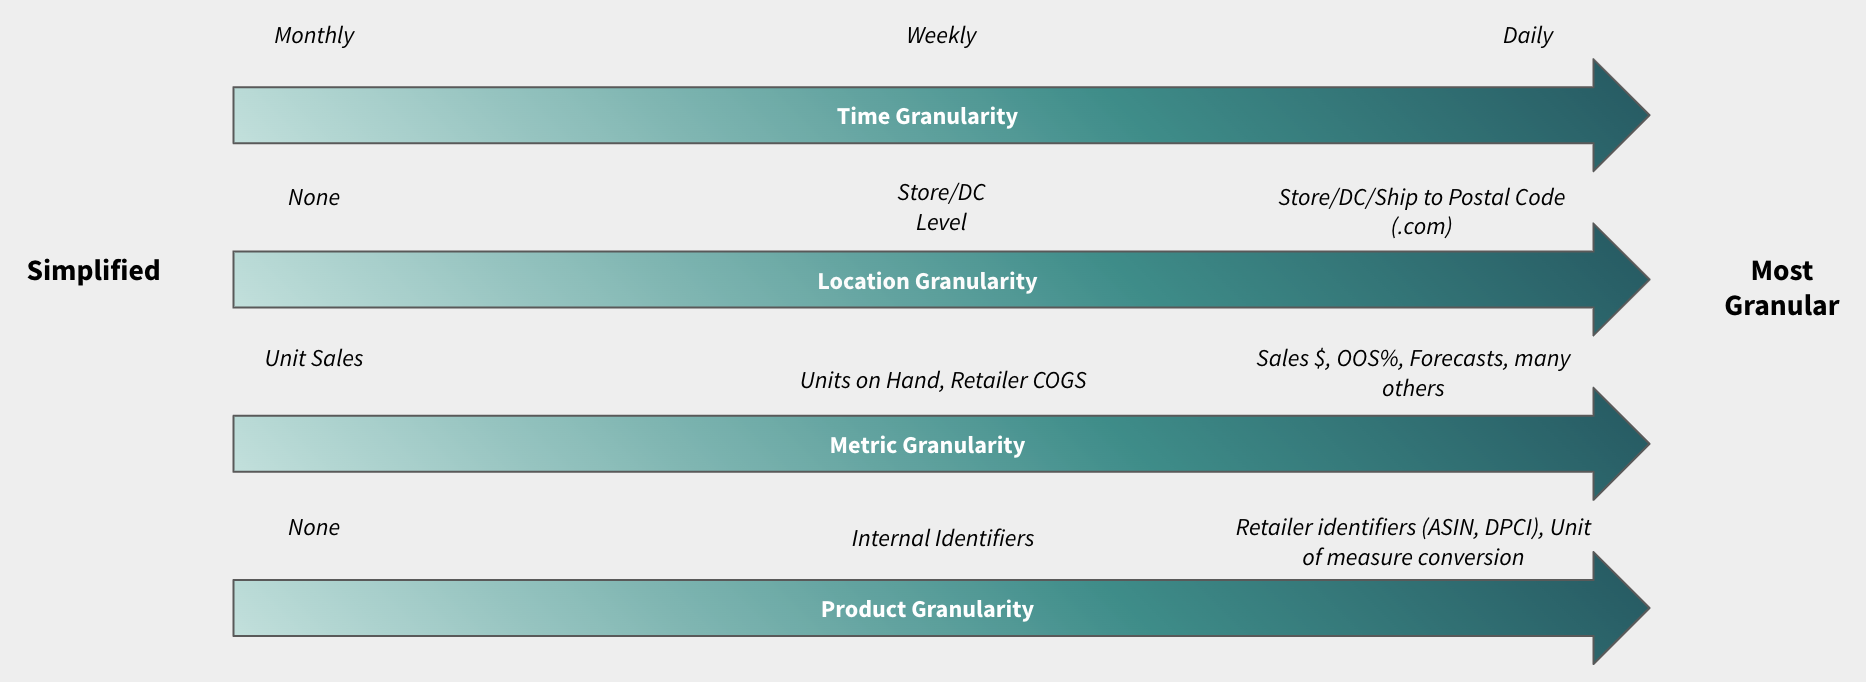
Each of these use cases can be enabled by a combination of data types of varying granularity. To accomplish the goal of each use case, different data streams need to be integrated.
Common data types often stemming from different data sources include:
- Time (daily, weekly, monthly, your fiscal calendar, retailers’ fiscal calendar, annual, custom, etc.)
- Location (postal code, city, state, region, DC, warehouse level inventories, in-channel product, store, etc.)
- Metric (gross or net unit sales, dollars, returns, margin, pack, presentation minimum, WoS, etc.)
- Product (SKU, UPC, GTIN, Retailer Part Number, Description, Category, etc.)
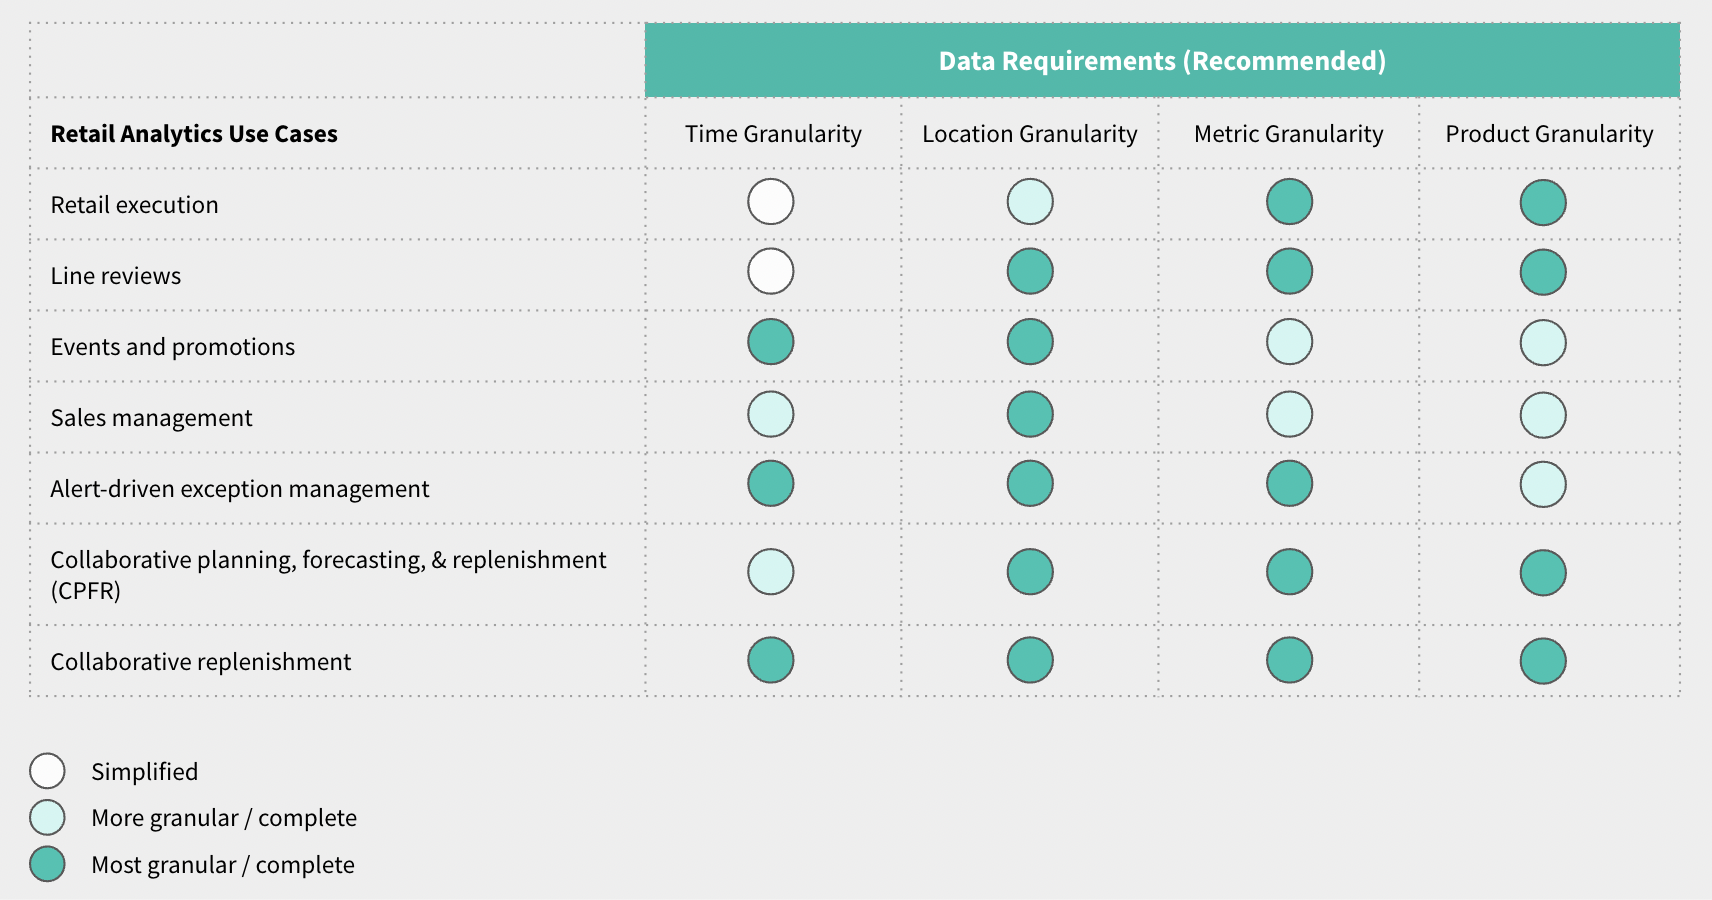
Start by reading the specific use case and then decide if it’s something your business is looking to accomplish with its retail analytics solution. Consider which types of data (time, location, metric) and granularity you need to complete the use case to your satisfaction. We provide our recommendation in diagrams 5.1 and 5.2.
5.1 Data platform architecture
5.2 Data Requirements
6. Use cases
Retail execution
Retail execution are the processes that sustain your relationship with your retailers even before getting into the nitty-gritty of day-to-day operations. Specific activities of retail execution include things like new product launches, assortment expansion, MAP pricing and sunsetting discontinued SKUs. These high-level activities require historical and real-time data to help make decisions on execution. Many companies attempt to assemble one-time reports to show how different actions will affect these activities’ likelihood of success.
Use a retail analytics solution to improve new product execution with real-time visibility into DC and store-level inventory, orders and shipments.
How a retail analytics solution can help
Retail analytics solutions provide workflows that help sales analysts, national account managers and planning teams identify and flag solvable execution issues in their retail network. These activities are analyzed to make sure established KPIs are being met and can be used to execute retail activities more successfully. These data points can also be brought to the attention of retail partners and used to advocate for specific changes that will help the brand. With relevant data at your fingertips, brands can position themselves for the best chance of success while strengthening their retailer relationships and earning goodwill.
Data granularity considerations
To successfully coordinate retail execution activities, data stored within the retail analytics solution should be as complete as possible. In order to advocate for additional shelf space for a specific SKU, for example, historical data demonstrating the lost sales caused by a lack of shelf space (and therefore limited WoS), needs to be presented. The more granular the level of data by metric, location and time, the better your chances are of achieving your desired outcome, whether that be successfully launching a new product or proving that your minimum advertised price isn’t negatively affecting margin.
Line reviews
Line reviews are a foundational process of retail operations. The objective of this process is to ensure that the retailer is making the most out of the available resources, maximizing top and bottom line by offering the right products, sold at the right price and offered at the right place and time. This process is usually owned by a retail buyer, who is responsible for the category your company’s products belong to (or for one of the categories you play in). Line review meetings are usually where big decisions are made and, as such, it is worth the effort to prepare well for a successful outcome.
How a retail analytics solution can help
During a line review, buyers expect their vendors to come with insights about your company, which can include financial projections, shopper demographics, category size, growth and share and suggested planograms and assortments. Other common insights include Sales Velocity, In Stock Percentages and Weeks of Supply, all with the goal of avoiding out-of-stocks. Brands can actually sell more if they can point to the high-moving goods which are at risk! It’s a win-win!
Within this framework, there is one element where a complete retail analytics solution can be extremely helpful, and that is taking the perspective of the retailer using the same data that they are looking at, instead of the perspective of your company with your internal data. Since data is identical to the retailer’s own data, there is no question of accuracy, which builds trust with the retailer. A multitude of questions can be answered with this data. How well are they doing by doing business with you? And what can they do to perform even better? What can you do that makes your company better off, but also make the buyer successful internally?
One key element, of course, is to have data-driven insights. But just as important is to make the insights actionable. This means that the buyer shouldn’t spend an afternoon in a spreadsheet to turn your slides into action. POS analytics solutions are designed to make sure this part goes smoothly.
Data granularity considerations
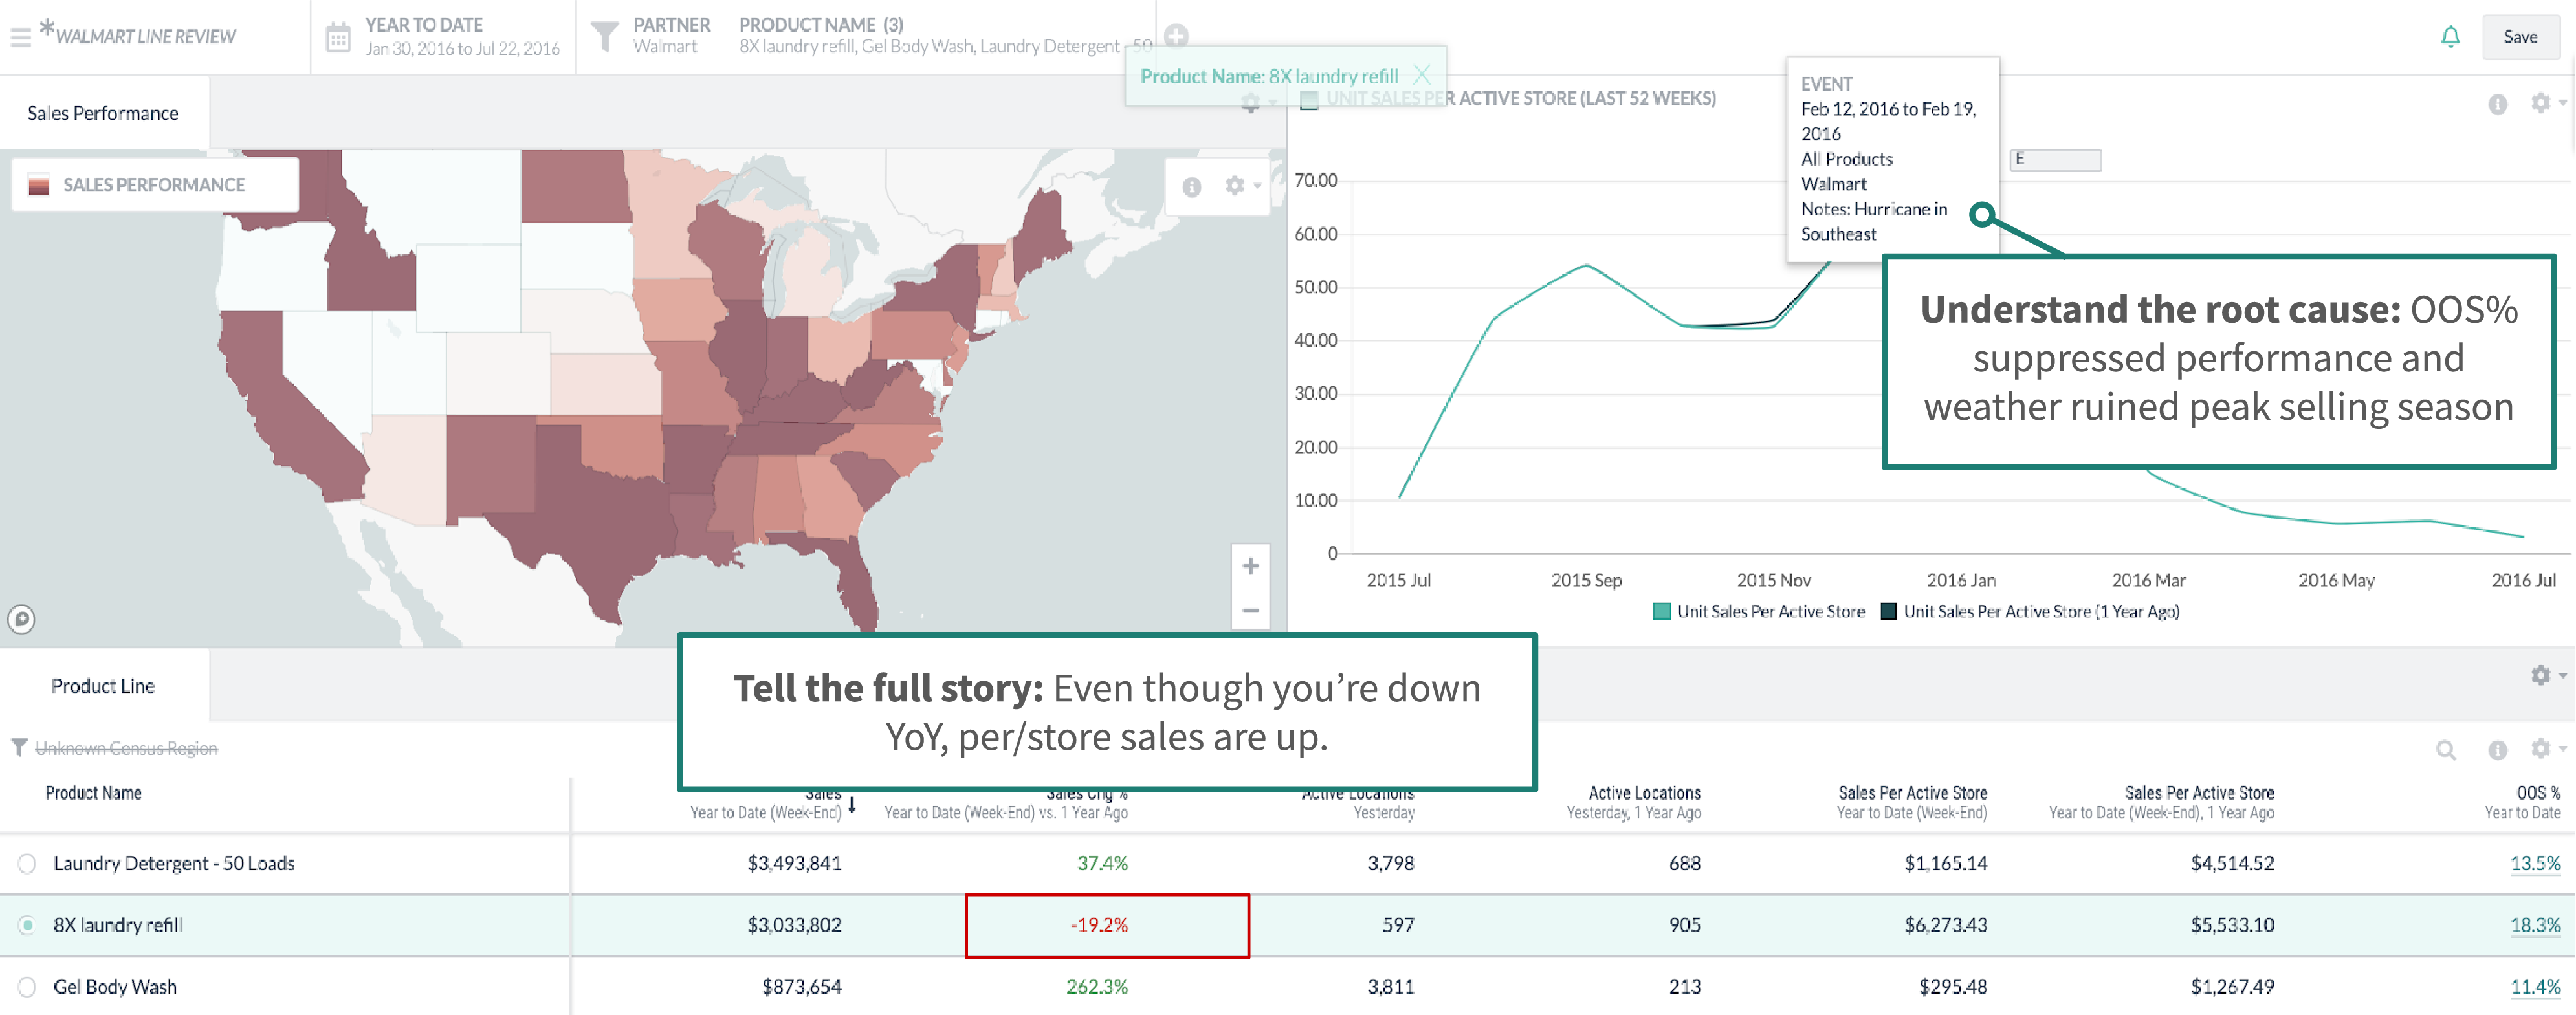
Enter line reviews with a complete, data-driven story to tell to your retail customer.
Depending on the granularity of data you’d like to be able to present to your buyers during these conversations, different solutions may fit your needs. If your goal is to be able to pinpoint issues down to the SKU and store level while making suggestions that take things like in-channel inventory into account, you will need to connect complex data from multiple sources. If you are not planning on executing comprehensive line reviews with your buyers, less granular or more incomplete data might suffice.
Think about what your retailer buyers need from you and how you would like to be able to present data to them as proof points for your recommendations. No matter your size, however, you should be taking advantage of all of the insights that a retailer provides. Often for major retailers, this includes not only sales trends, but margins, inventory positions, on-shelf availability, new product performance, regional performance, etc.
Events and promotions
Most brands run events and promotions to gain additional sales and encourage new customers to try their products. These may center around a specific holiday or season, while others may be a one-off sale to encourage a new product to perform well. Companies pour thousands or even millions of dollars into displays and product packaging, making these events and promotions a costly operation. Without access to all of their real-time, regional data in a single place, sales and marketing teams are unable to judge the effectiveness of their marketing investments, even well after the fact.
How a retail analytics solution can help
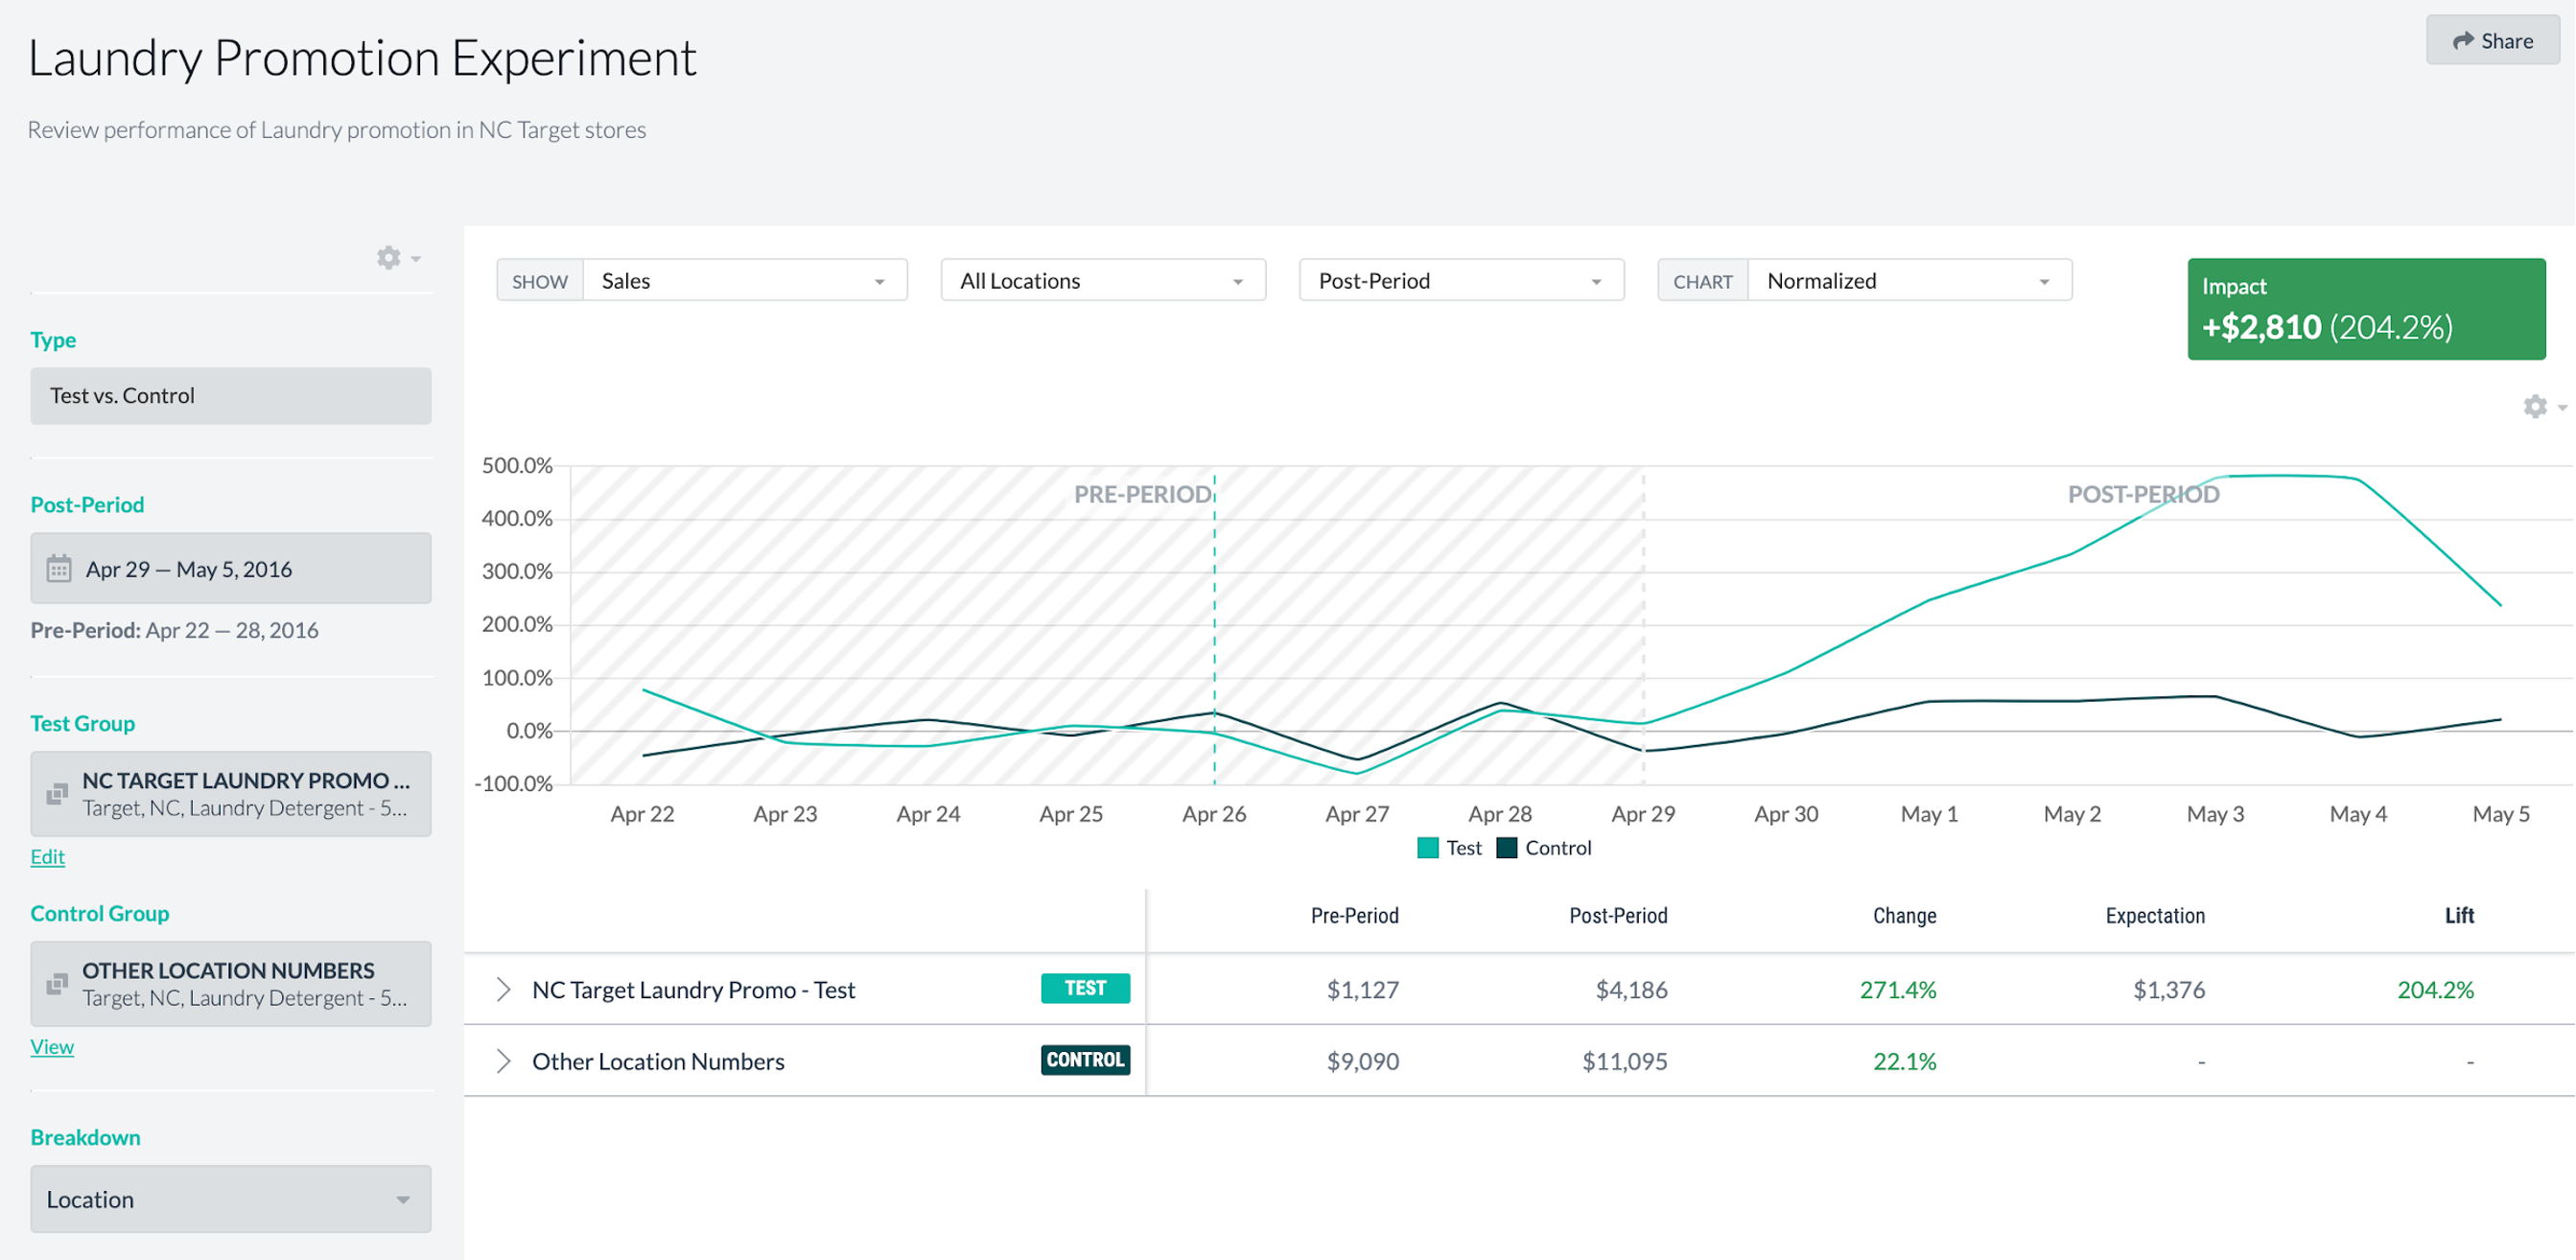
Scientifically measure POS lift from promotions, end-caps, events and more with guided workflows within a retail analytics solution.
Measuring the success — and potential — of your events and promotions is a key function of retail analytics. Automated tools within advanced solutions make it easy for brands to measure every single marketing activity in real-time, so they can continually cut bad investments and double down on what’s working. A/B testing for upcoming event expansions can be set up quickly with a dedicated workflow, quantifying sales lift and making it easy to forecast the impact of promotions and events yet to come. Price elasticity can also be tested to ensure demand isn’t too affected by price changes.
Data granularity considerations
With granular location, time, and metric data, brands can make the difficult decision to stop an upcoming promotion from rolling out to additional stores if ROI hasn’t been proven, saving the brand money. With only basic time and unit metrics, however, brands can “watch” their events after the fact and make educated guesses about their overall performance. How much and how frequently your brand is running events and promotions may change your need for data granularity to prove marketing ROI.
Sales management
There is often a dedicated role within an organization tasked with reporting on sales trends and sell-through. This person might have a system in place to report on weekly, monthly and quarterly sales velocity by retailer. Their main goal might be to ensure that the company is remaining profitable, but valuable insights might be being lost. Complete sales management involves a higher level of understanding of sell-through, not only sell-in to your retailers.
How a retail analytics solution can help
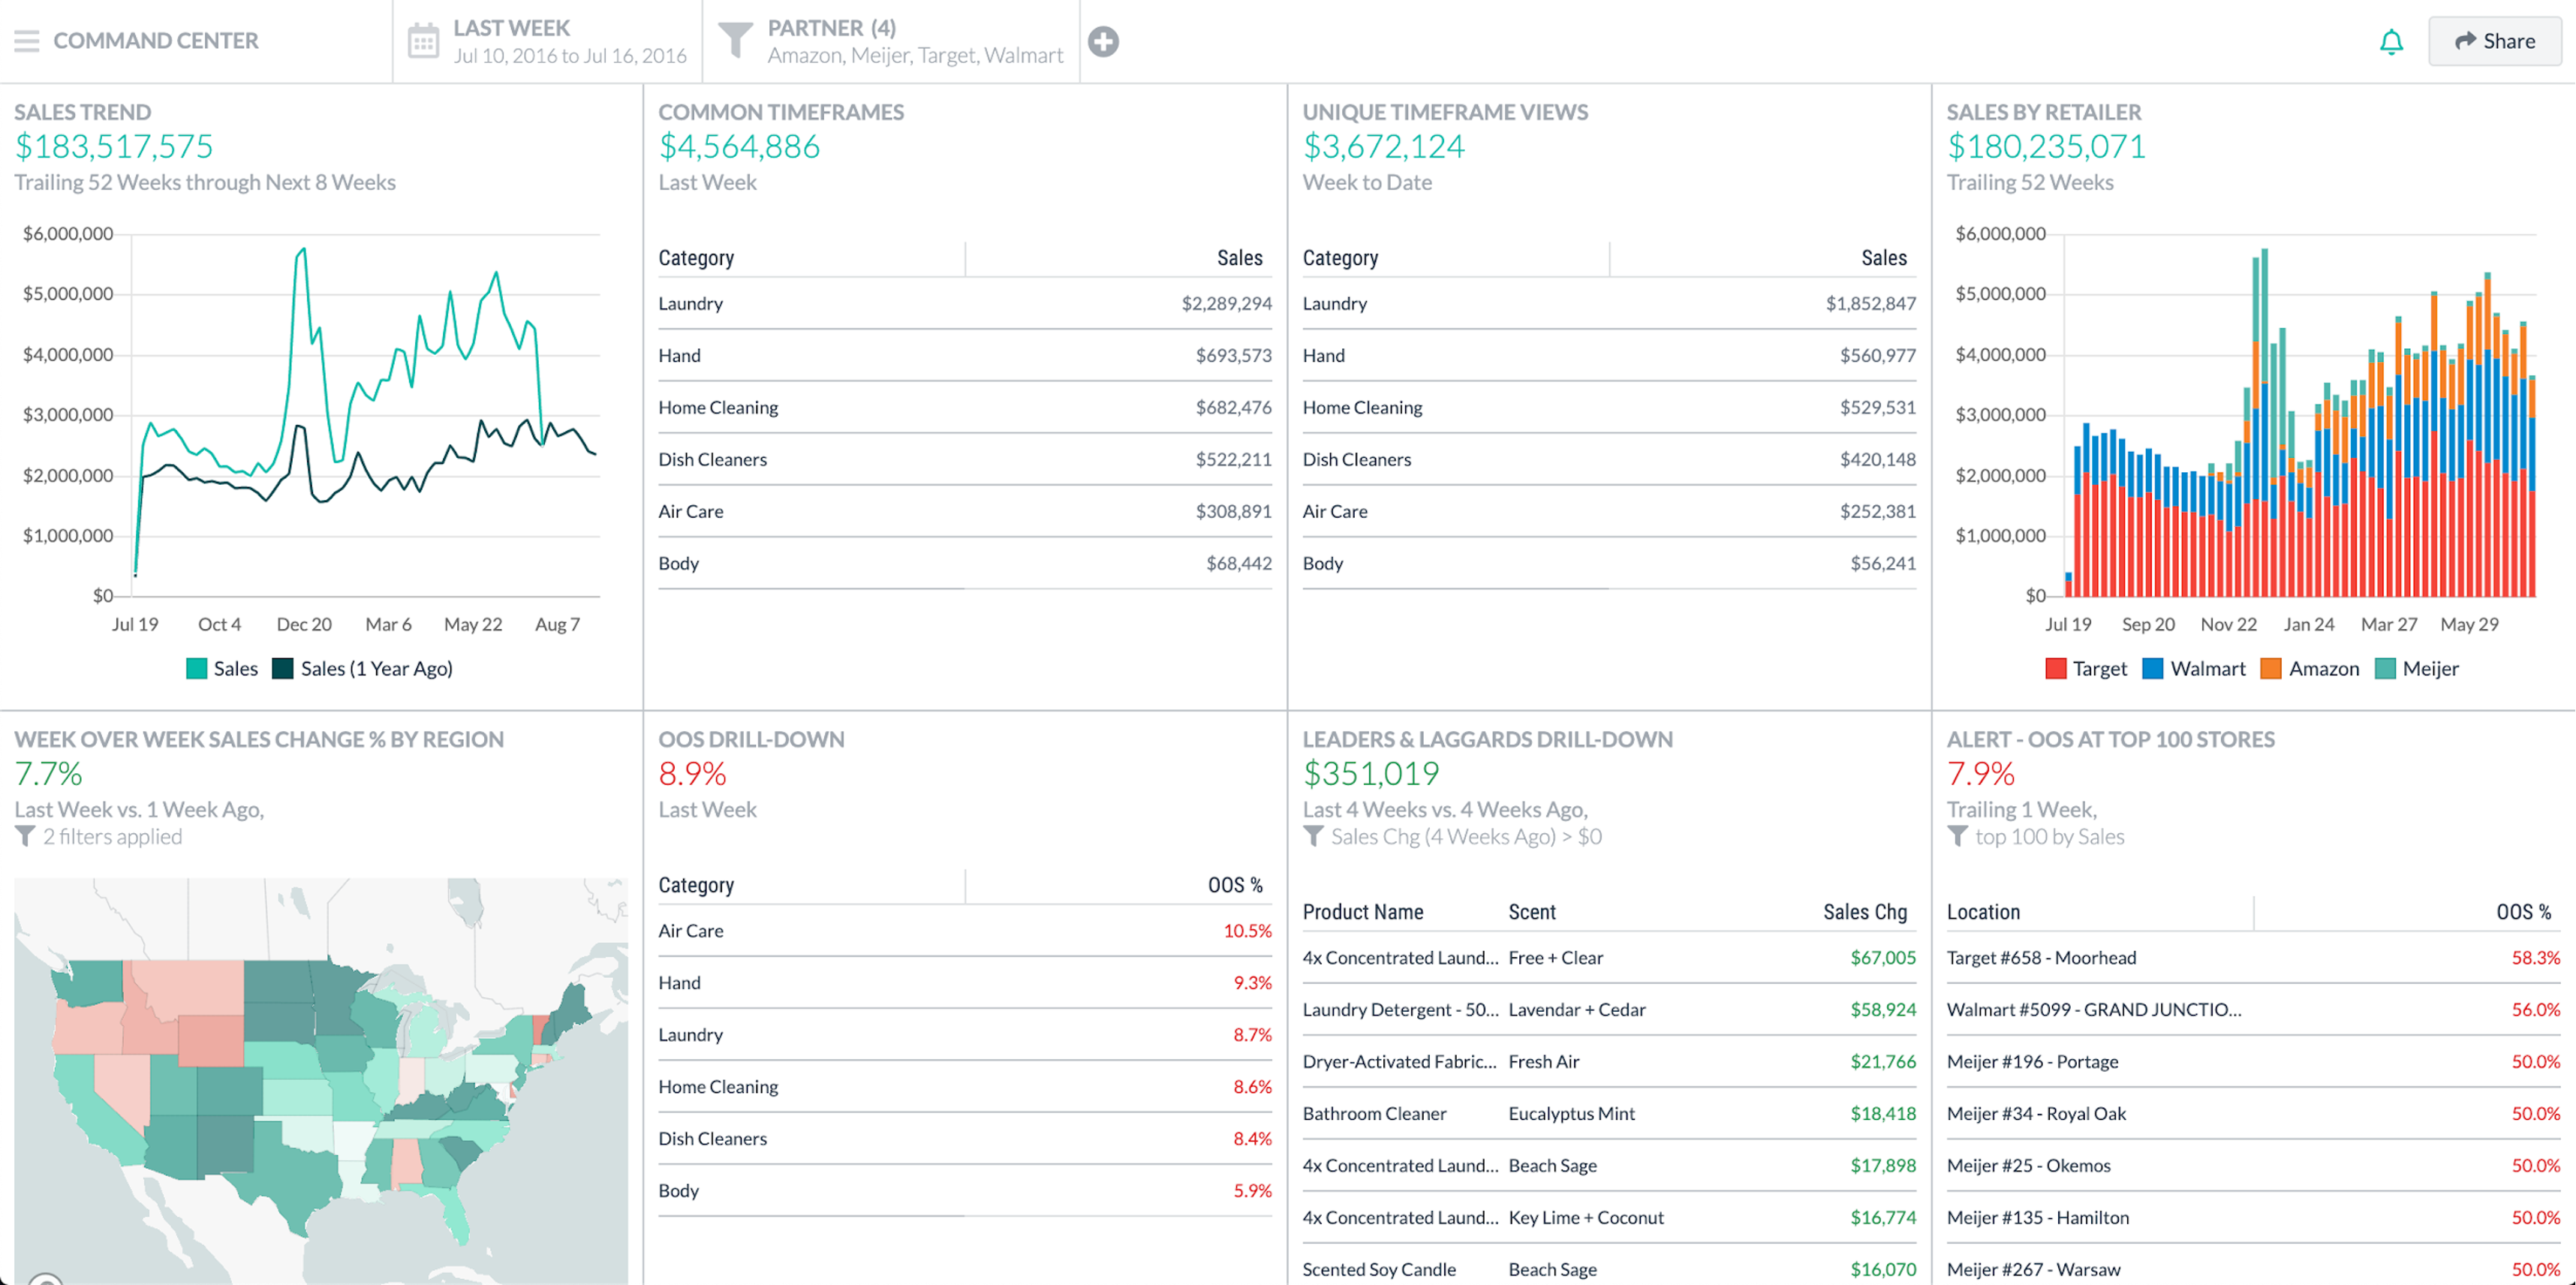
Prioritize based on impact by building a command center that helps you stay on top of KPIs and always know which reps, categories and partners need your attention.
A retail analytics solution with a built-in command center can help you stay on top of sales KPIs and always know which partners, categories, and reps need your attention. You can better manage by exception within a single pane of glass across your business and prioritize based on impact and margin. Alerts such as “highest lost sales” or “cross channel sales by region” and “performance vs. forecast” can be set up so that you know what is important without wasting time combing through data. And since the most granular level of data is often preserved in POS-driven retail analytics solutions, the user can drill into any discrepancy to discover the answer to a multitude of questions.
Sales analysis by geographic location can also be completed within a retail analytics solution. A user should be able to identify where sales are strong/weak based on region, zip, retailer and by SKU, sub-category, or another unifying metric. Additionally, a brand should be able to toggle between brick & mortar and eCommerce to see discrepancies and patterns as they relate to their different sales channels. Within eCommerce, divisions such as in-store pickup, ship-to-store and home delivery should be clearly visible for the best insights.
Data granularity considerations
This is perhaps the use case with the most variation in levels of data granularity. You can have simple data and still gain some understanding about your sales trends. If the only objective you have is a weekly or monthly sales report, then you can apply the least common denominator logic. If daily data is provided, for example, a user can manually roll it up into weekly or monthly estimates. These simpler reports might suffice for high-level communication to senior leadership but leave little room for customization or additional questions. If you need to manipulate the data to see trends, simple data won’t cut it.
Alert-driven exception management
Managing by exception using real-time alerts saves teams countless hours combing through “good” data looking for discrepancies. For example, an account manager looking to understand the overall OOS rate of a specific SKU across all retailers would need to manually combine incompatible data from numerous sources, then pour through the report looking for outliers compared with the forecast. This process is highly manual and wastes valuable time.
How a retail analytics solution can help
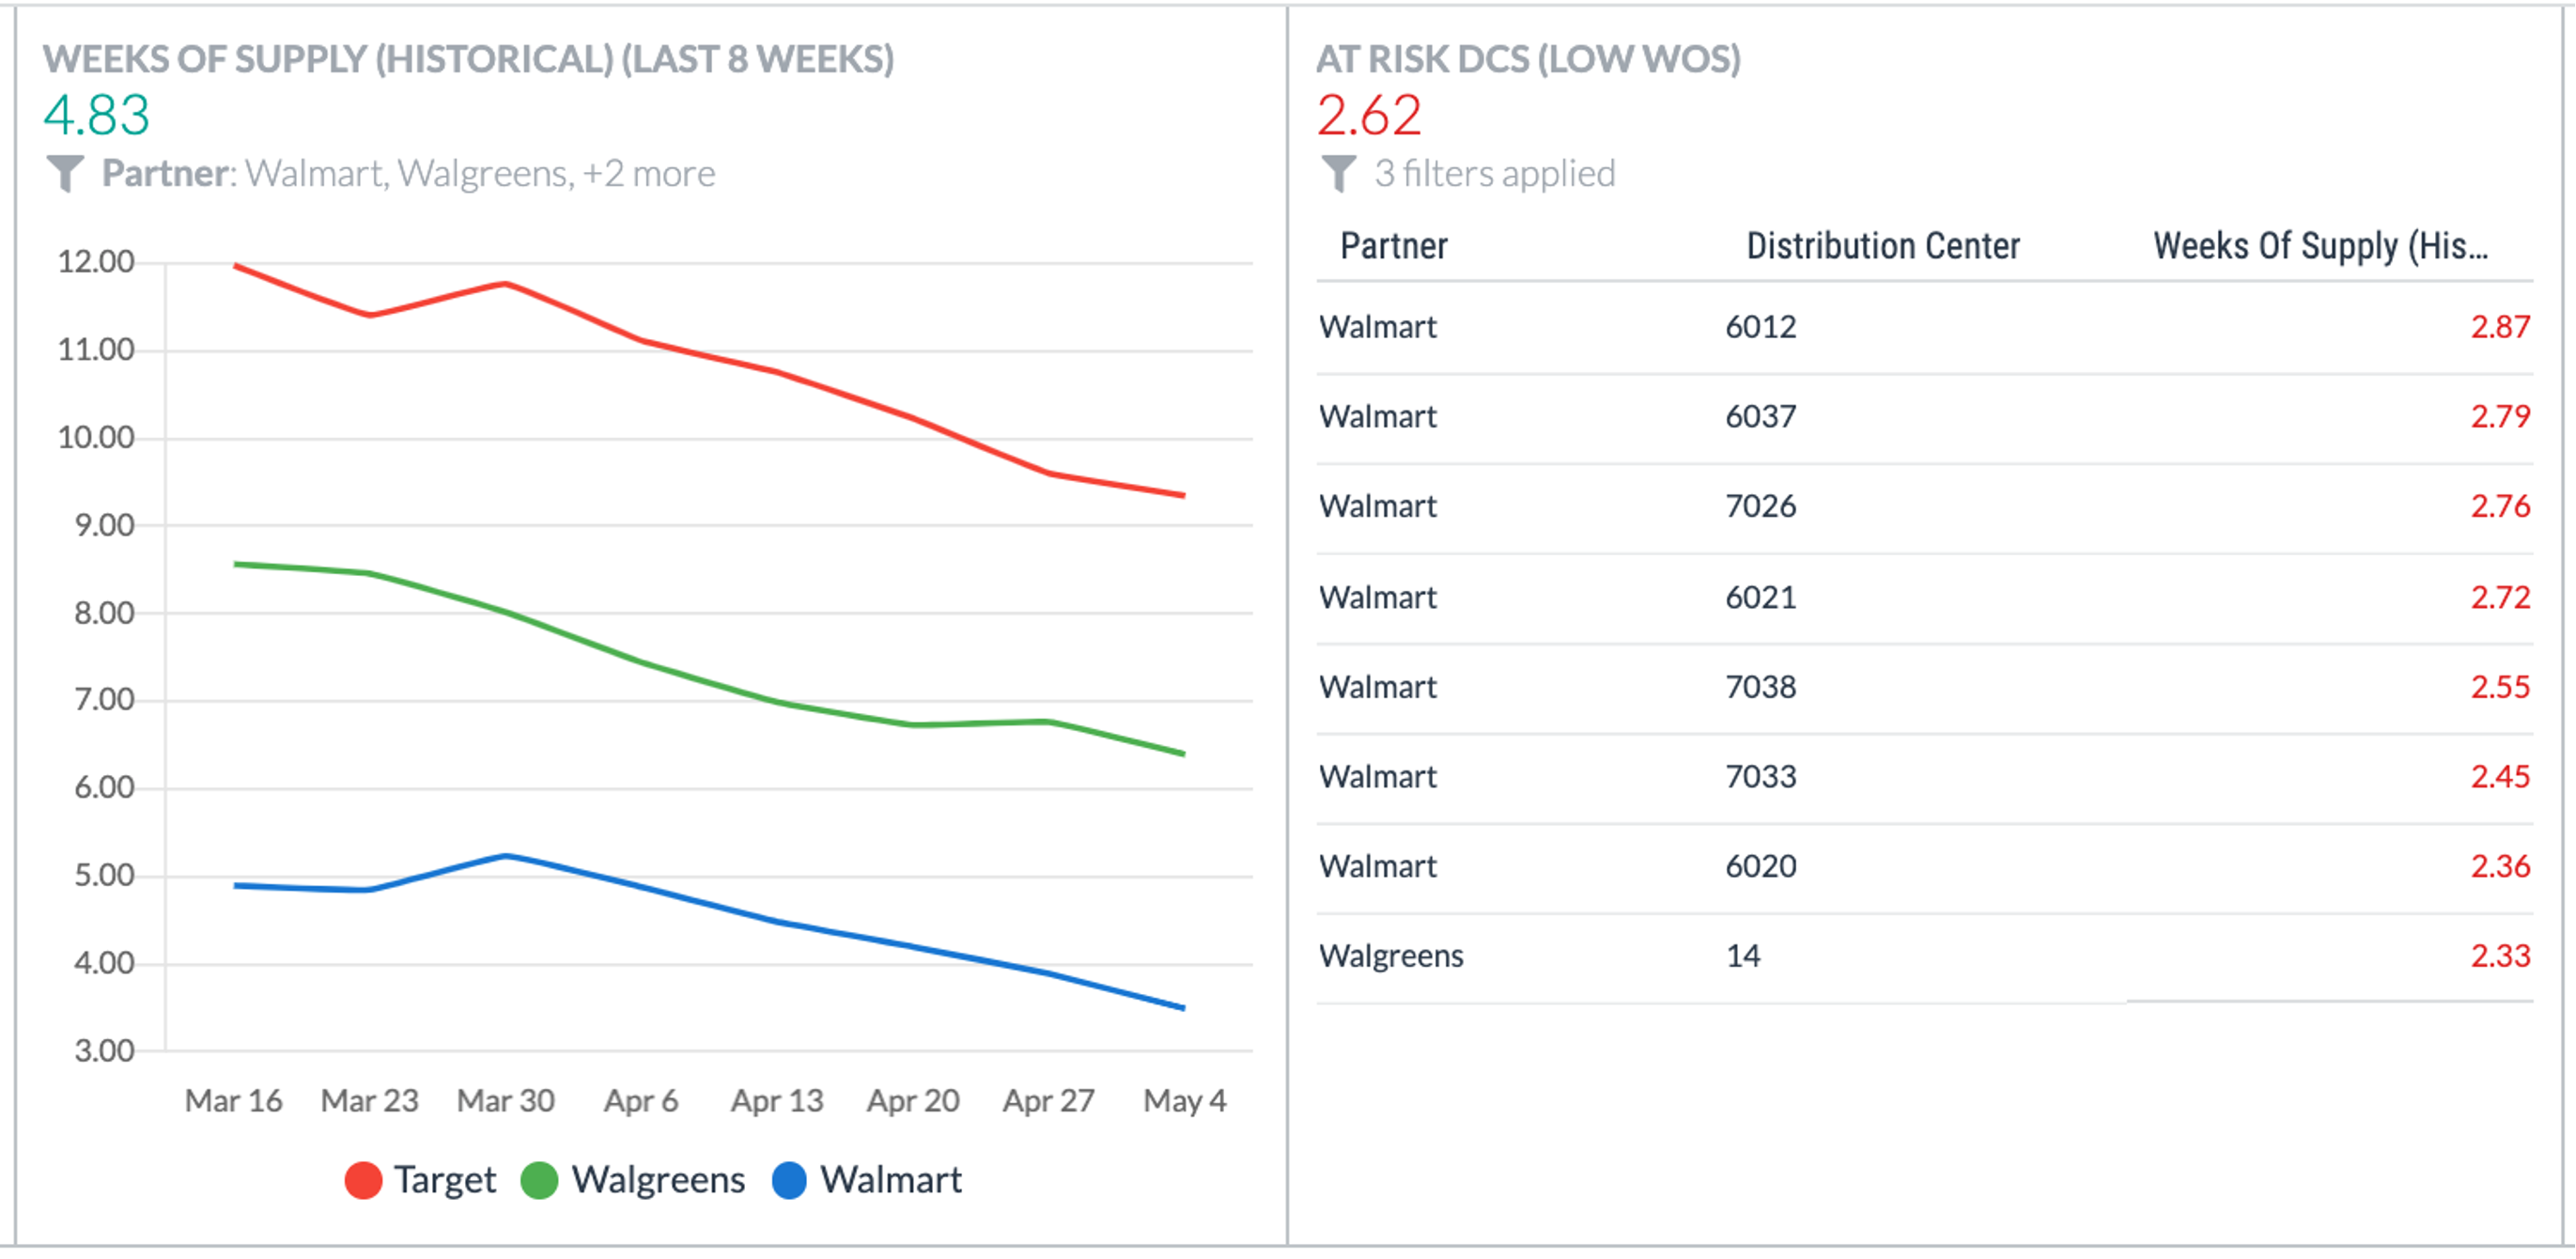
Get alerted to DCs that are at risk due to low WOH so that you can take action before shortages become a larger problem.
With a smart retail analytics solution, pinpointing the outliers becomes quick and easy with prebuilt as well as custom workflows and dashboards. These workflows should be configured based on real-time demand and inventory feedback loop across the network. Within these specific workflows, a user can quickly see where OOS rates are the highest, where the company is losing the most money due to lost sales, see where spoilages might occur because of high WoS rates, where phantom inventory has been detected and many other metrics. Dashboards can be set up to alert users when a certain supply chain issue arises. Questions that come from the executive team can be answered and additional data provided with drill-downs built into the reports.
The main benefit of these alerts is that users can get ahead of issues before they arise. This saves time, can help reduce lost sales, limit spoilage and help keep proactive communication flowing between the retailers and the brand. A retail analytics solution can help a brand manage by exception to stay focused on the biggest drivers of lost margin.
Data granularity considerations
Effective alerting capabilities require the highest level of data granularity to be incorporated into the system. The system needs to be able to match up retailer forecasts with in-channel inventory, POS data, order information as well as countless other inputs. These inputs should capture metrics down to the SKU level, including store locations, gross or net unit sales, dollars, returns, margin, pack sizes, presentation minimum, WoS, etc.
Collaborative planning, forecasting & replenishment (CPFR)
Most enterprises have a set of standard practices in place which help them plan key supply chain activities to match up consumer demand with supply. These activities may incorporate internal and retailer demand forecasts as well as information on in-channel inventory and available inventory at their own warehouses. All this data can be tough to extract useful information from and is often a highly manual and cumbersome operation. Entire teams of planners may be dedicated to manually creating shipment plans based on retailer forecasts and fighting fires as those plans change. Understanding the current state of inventory and actual demand can greatly influence allocation and replenishment decisions.
How a retail analytics solution can help
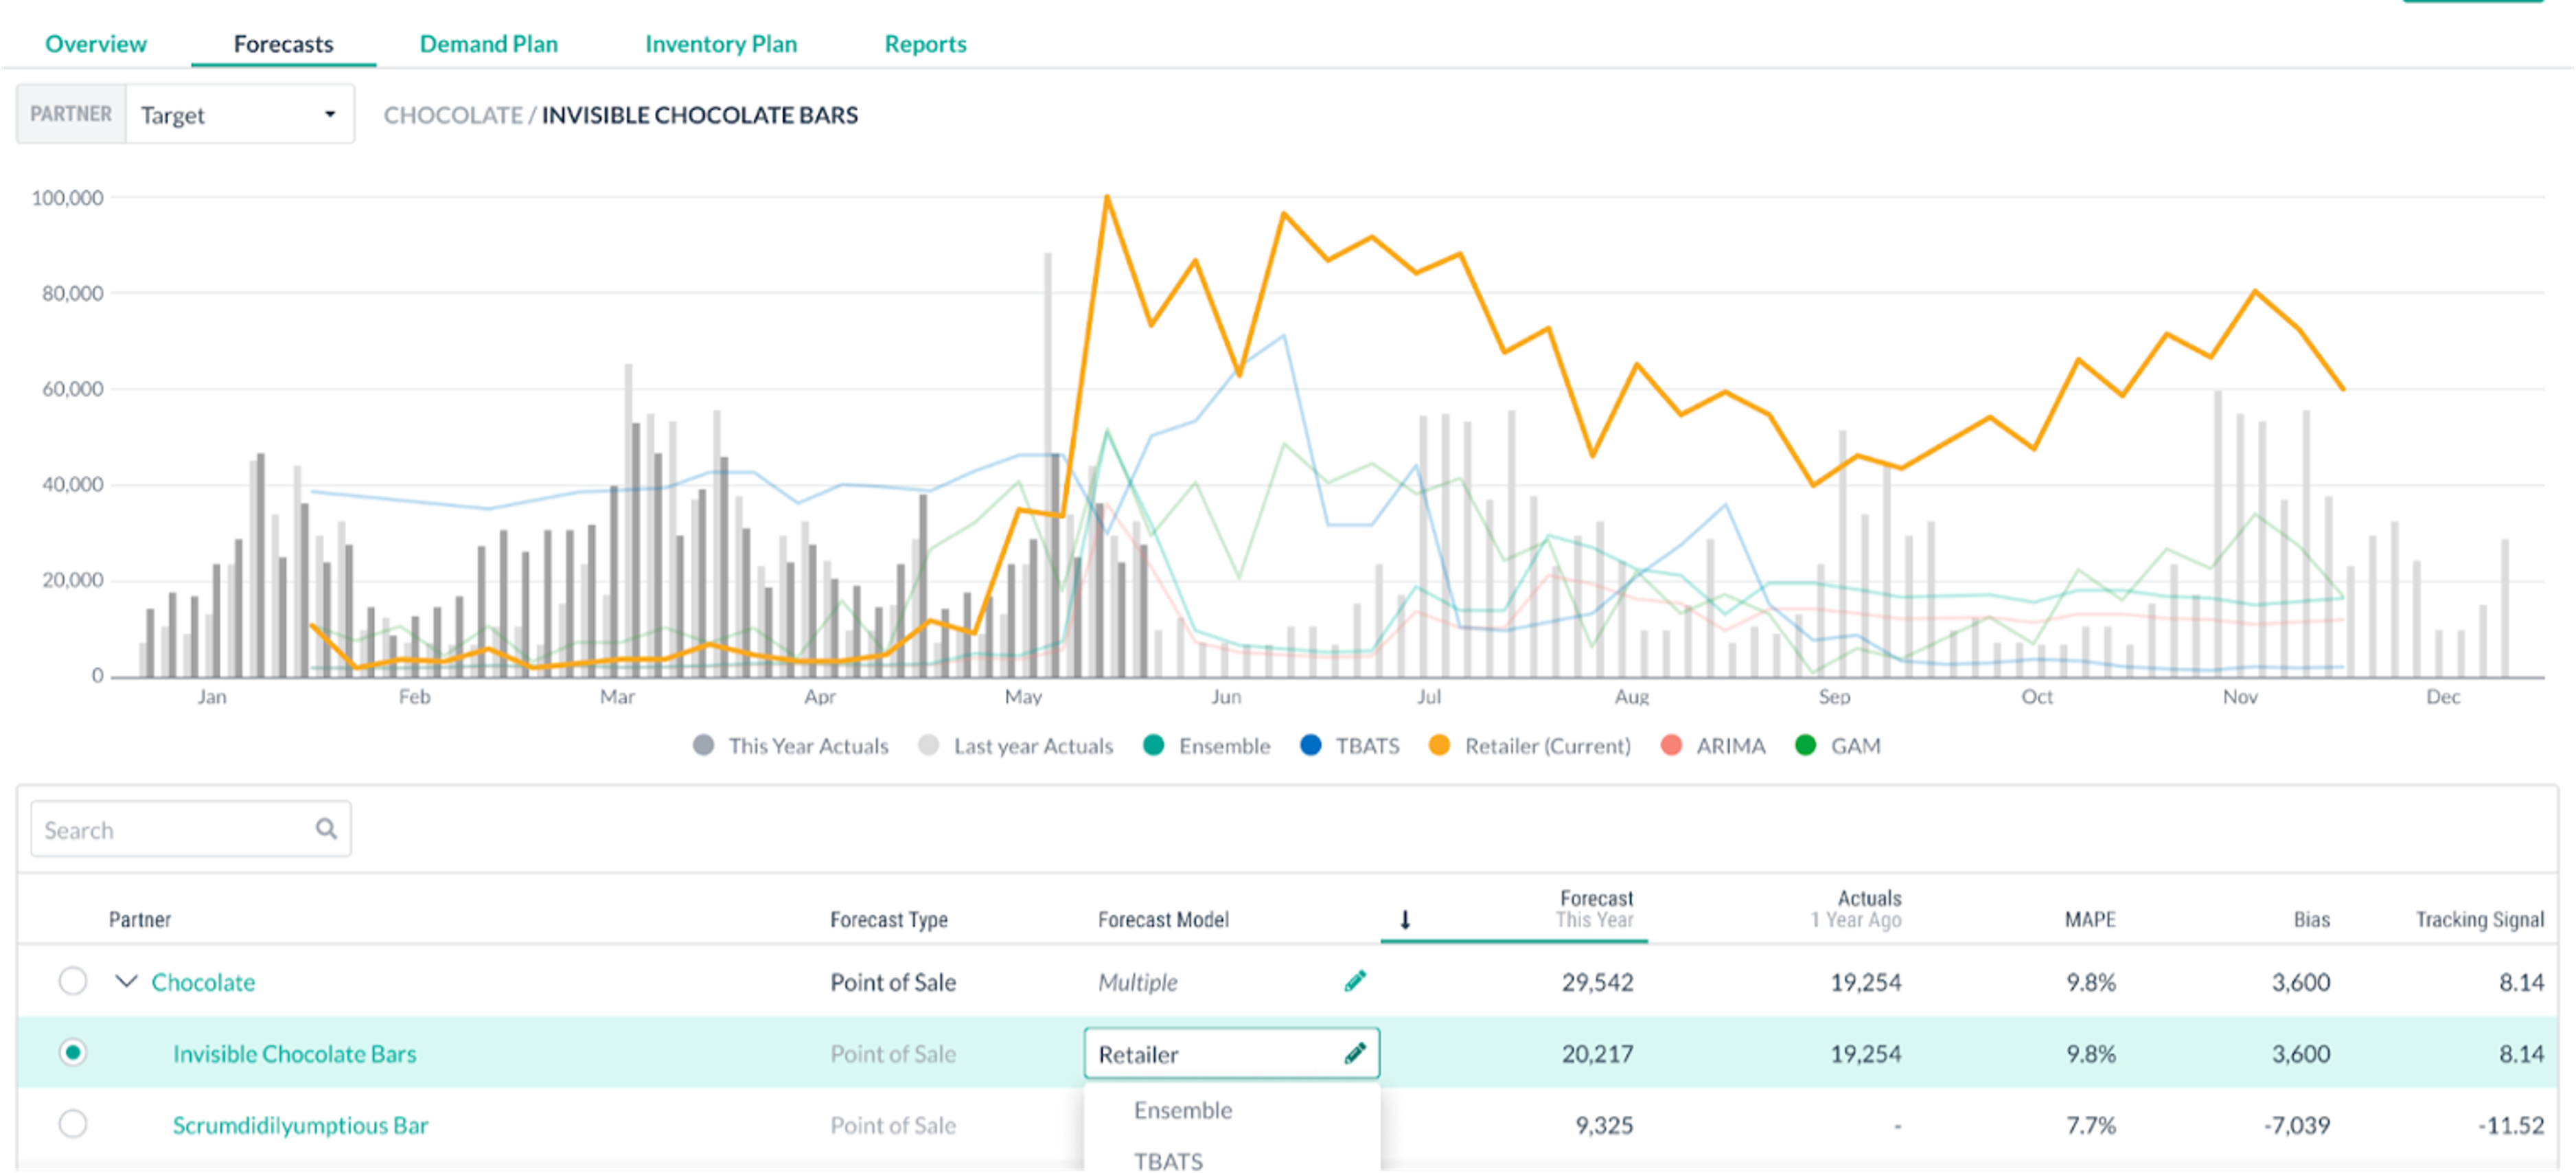
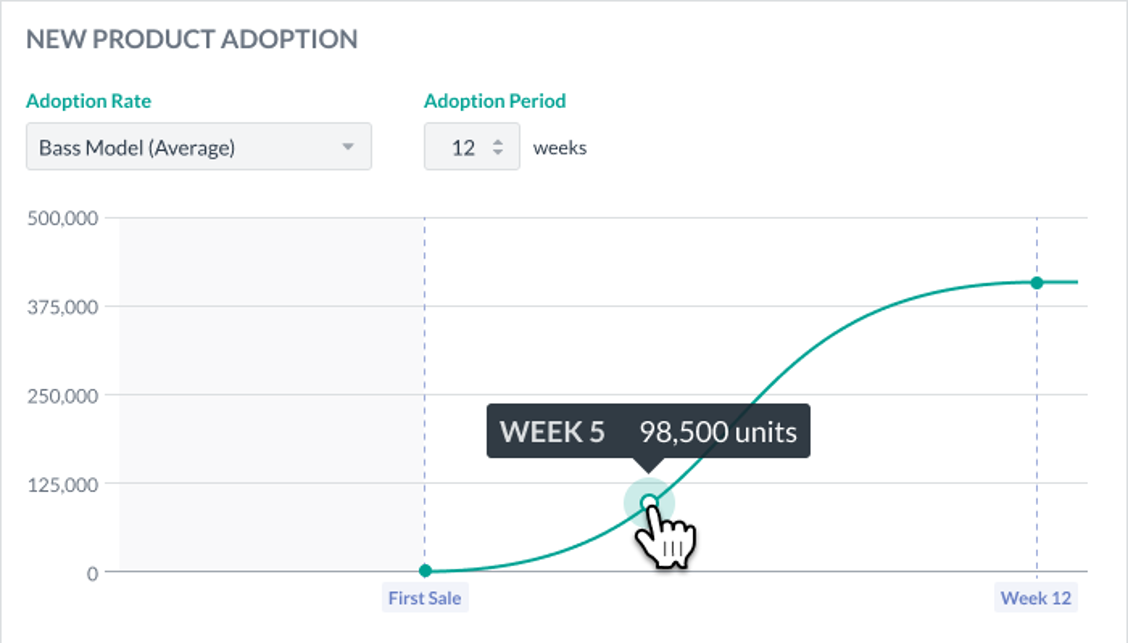
Integrate internal forecasts and retailer forecasts to compare alongside standard statistical models to dynamically track your products’ demand and supply.
Retail analytics platforms can integrate a brand’s current plans and forecasts into its system to seamlessly compare with actuals on an ongoing, real-time basis. Forecasts can be manipulated with different statistical models within the system to help the user identify which trend is the most accurate for a subset of products. Alerts can help them manage by exception and dedicate their time to the most high-impact SKUs by responding faster to market signals based on daily store-level insights.
A combination of visibility to in-channel inventory, open POs, inbound product from the manufacturer as well as real-time sell-through can help the brand assess whether the retailer is placing the right order quantities to meet demand. During line reviews, the brand can then make recommendations to improve replenishment and boost sales. They can also leverage forecast versioning data to contest inaccurate fines.
In a nutshell, by bringing together forecasts, ERP data, POS data as well as data from distributors, etc., brands can improve their CPFR processes by gaining a better understanding of their supply chain.
Data granularity considerations
CPFR improvements require the highest level of data granularity available to the brand. Demand forecasts, as well as shipment plans, should be automatically fed into the platform. If metric, time and location data isn’t available, it becomes impossible for the user to extract real insights about replenishment needs and forecast changes. To truly streamline CPFR processes, connecting all data available will set the brand up for the best chance of success.
Collaborative replenishment
Retailers are increasingly expecting suppliers to provide data-driven recommendations on not only what orders to place, but also store-replenishment recommendations. On top of that, when orders exceed available inventory, brands have to make difficult decisions about which customers and orders to prioritize. These decisions are often highly contentious and require weighing conflicting priorities, customer relationship dynamics and other important pieces of context like promotions or geographic differences in demand.
Making these decisions is just half of the battle. Customer-facing teams also have to proactively communicate with different partners to mitigate the impact of any customer service disruptions.
How a retail analytics solution can help
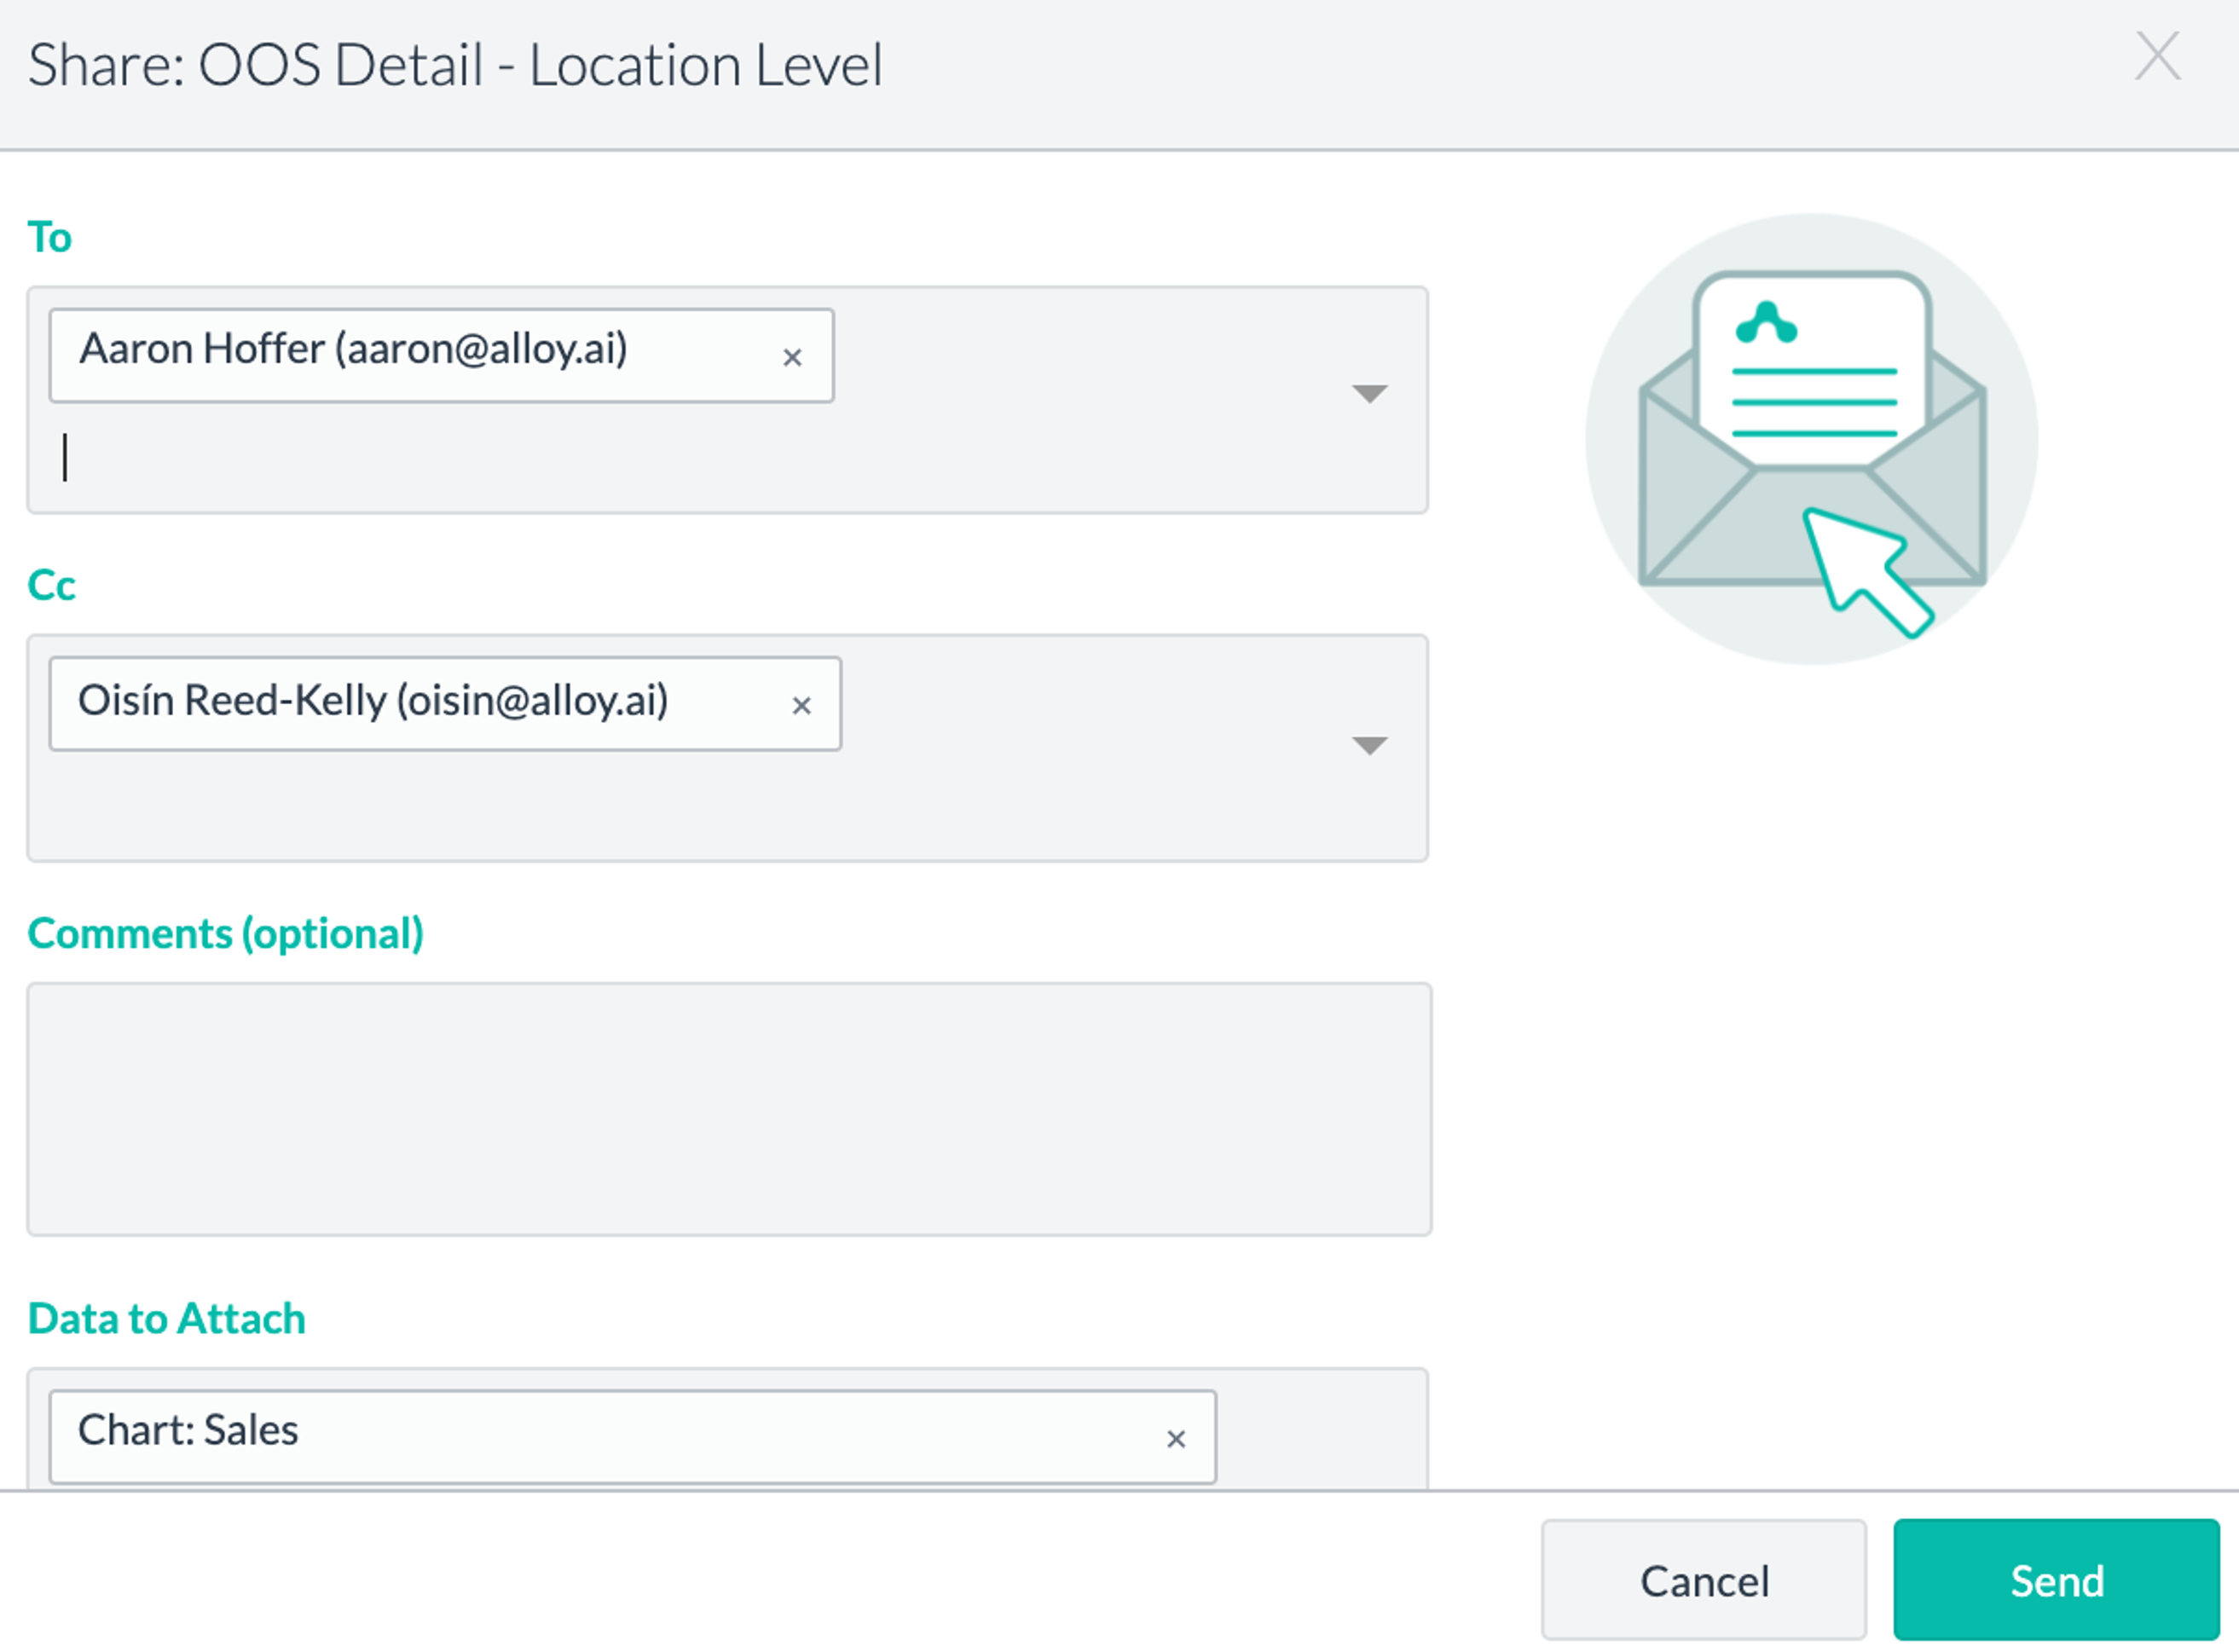
Use a retail analytics solution to share insights with your retail buyers on where you’re both losing sales and make order recommendations to drive action.
Allocation decisions and order recommendations to retailers have to be made at the speed of business. Unfortunately, few companies have the analytical muscle to support these decisions with retail data. That’s where retail analytics solutions come in. Customer-facing teams use retail data including store-level insights and reorder point data to communicate decisions and make recommendations to their partners. This is particularly useful if a partner’s orders exceed their needs — in many cases, retailers are willing to adjust must-arrive-by dates or quantities if their suppliers can back their recommendations up with retail data.
Data granularity considerations
In order to gain a full picture of existing inventory, including inbound shipments from the manufacturer or distributor, brands need to connect data about retailer inventory positions, forecasts and sell-through. This data is then bumped up against upcoming order information extracted from an ERP and manipulated by the system to show where there will be gaps. If granular data down to the SKU is incorporated, users can make adjustments within the retail analytics platform to see what the outcome of specific allocation decisions would entail. They can use that insight to allocate existing inventory to best accommodate their customers.

7. Measuring the ROI of a retail analytics solution
It is essential in your RFP process that you understand the ROI the solution can provide. If your vendor cannot succinctly show you how your company will save money — in addition to time and efficiency savings — then steer clear. For companies moving from a combination of manual and BI tool reporting, a full-fledged POS analytics point solution built for consumer brands will rapidly pay for itself.
Increase sales
- Fix out-of-stocks. Your retail analytics solution should be able to lower your out-of-stocks, thus improving on-shelf availability and increasing sales. In some cases, calculating enough dollar savings to cover the cost of a new system can be accomplished in a matter of weeks. If with the help of your new solution, you can identify and fix an out-of-stock issue for a single SKU, that can add up to significant additional savings across all stores. Even a 1% total improvement in on-shelf availability may equate to hundreds of thousands of dollars depending on the size of your company.
- Fix phantom inventory. The solution should also help you address other OSA issues such as fixing phantom inventory. Phantom inventory is one of those issues that often go unresolved simply due to its complexity. Manually trying to identify phantom inventory is impossible on a large scale due to the numerous data streams and continually updating data available. Many enterprise brands lean on Field Sales teams to check physical store locations to see if there are any holes on the shelf. This isn’t a good use of anyone’s time. Additionally, it’s up to the brand to convince their retailer that there is an error in their data. The retailer needs to first believe that there is phantom inventory. Then they must zero out the product or place a new order to get the automatic ordering system functioning again properly.
A retail analytics solution should be able to demonstrate the specific workflow used by its current customers to quickly be alerted to phantom inventory with the data to back up recommendations to buyers at the retailer
“We use Alloy to really drill down in the data. If you have a retailer that’s underperforming expectations, why is that? When you peel back the onion and you look at sales by store, you can identify issues in different regions, like inventory shortages. A lot of retailers aren’t great at identifying those issues for you.” – CJ Prober, CEO @ Tile
Prevent overstocks
- Improve forecast accuracy. A complete retail analytics system should be able to help you avoid spoils, chargebacks and returns. Through fixing known high weeks of stock, a comprehensive strategy for overstock prevention can be set into motion. One method for doing this involves improving forecast accuracy to ensure retailers are ordering correctly based on real-time consumer shopping at the POS.
To do this, the solution needs to be able to ingest your forecasts and shipment plans along with all data provided by your retailers, including POS data. Historical trend data should also be captured. The solution should let you access and customize reports which alert you to inaccuracies in your forecast based on any number of factors.
- Monitor and address gaps in real-time. Continuously monitoring the accuracy of your plans and proactively addressing gaps and discrepancies as they arise will help you to keep on-shelf levels high without accumulating excess inventory.
Consider the costs associated with spoils and returns and compare that with the price of a new retail analytics solution. What percentage of these costs need to be eliminated to cover the expense of the system?
 Avoid OTIF fines & improve service levels (SLs)
- Use forecast versioning data. Often, retailers will increase their forecasts in the very near term and then place orders against those new forecasts. That leaves the brand in a tough position to fulfill those orders and may result in poor service levels and OTIF fines. During subsequent line reviews with your retail buyer or planner, you will be called into question about why your SLs have suffered. To your counterpart at the retailer, they may only see the current forecast and your actual fill rate, casting your business in a poor light. If you do not have the forecast versioning data to back up your claim that the forecast was changed recently, it will be hard to argue why it wasn’t your fault. A complete retail analytics solution will help you capture versioning history and generate reports based on trending data.
- Improve forecast accuracy. Improving the accuracy of your forecasts doesn’t only prevent out of stocks which can lead to lost sales, it can also help you avoid OTIF fines by improving your service levels. By forecasting more accurately, companies can communicate effectively with their manufacturing partners or departments so that the right product mix and amount can be produced. This way, it is easy to fill retailer orders as they come, keeping service levels within the agreed-upon range and reducing the risk of OTIF fines.
- Proactively anticipate forecast changes. Perhaps more important than being able to argue why SLs are incorrect is the ability to proactively avoid the issue in the first place. By monitoring the same data your retailers do, their POS data, you can proactively anticipate changes to the forecast before the retailer makes those changes and orders additional quantities. This means you can attempt to source additional product to be ready for larger orders. Getting ahead of the retailer even before the retailer knows to make a change will help you avoid fines and keep SLs high.
Save time
- Time savings is possibly the most difficult ROI metric to calculate. It is, nonetheless, frequently cited by happy retail analytics customers as a key driver of value. Time savings take many forms, it may simply be being able to expedite ad hoc dashboard requests from your executive team or automating manual processes that previously took hours each week. For many brands, being able to automate away manual tasks and reinvest that time into value-add initiatives provides value at once. Getting ahead of issues before they arise also limits the number of “fires” a team needs to deal with so that everyday operations can be taken care of as seamlessly as possible.
“Instead of spending all of that time trying to put all the data in one place and format it and clean it up, now our team — the same number of people — can spend that time looking at the data and gaining actionable insights and things that we can actually do with it, versus just trying to understand what it means.” – Matthew Bergum, Director of Power Tools @ Bosch
8. Technical checklist for IT teams

Technical teams can benefit from determining if vendors have these capabilities early in the RFP process. Are these features standard for existing customers or will additional functionality need to be custom-built?
- Secure cloud storage (SOC-2 Compliant)
- Automated POS Data Ingestion & Maintenance (location/SKU/day)
- Automated ERP Data Ingestion & Maintenance (location/SKU/day)
- Automatically updated data Network Harmonization (locations, shiplanes, DC to Store mapping, etc.)
- Time Harmonization (fiscal calendars, data frequencies, etc.)
- Product Harmonization (product IDs, hierarchies, pack sizes)
- Calculated Metrics (at every location/SKU combination)
- Bulk Data Export Backup, restore, and disaster recovery processes
9. Customer service checklist for users

A good retail analytics solution will become ingrained in your daily supply chain processes. Knowing that customer support is available for any issues that arise as well as questions and training will make your investment worthwhile.
- Intensive onboarding and implementation support
- Access to a dedicated account manager
- Access to a help center
- Unlimited ticketed support in-app and via email
- Proactive support notifications
- Ongoing live dashboarding
- Proactive value analysis and best practice sharing
- Scheduled reviews on engagement, achievements and strategic insights