
Get more out of your Target Partners Online retail data
Target Partners Online serves as a central platform for brands with a Target presence looking to access retail data through Target’s data hub, known both as Vendor IQ and Greenfield. If you are part of a dedicated Target team or manage a brand that has products on Target shelves, utilizing Target’s Partners Online portal is crucial.
To maximize the benefits of retail data insights, it’s essential to use Target Partners Online effectively. At Alloy.ai, we work with dozens of Target retail vendors of varying sizes from across the consumer goods industry.
In this article, we will delve into four methods we’ve seen our customers successfully optimize their usage of Target Partners Online retail data with Alloy.ai.
What you will learn in this article
What is Target Partners Online?
Target Partners Online is the web portal where vendors selling into Target can extract reports on their retail sales data and performance.
It can be found at www.partnersonline.com. Access and secure logins are given to all Target retail vendors to share Target data and communicate within a single portal. Like any retailer portal, Partners Online is strong in some areas and lacking in others, making it essential that you understand the abilities and barriers to make the most of its offerings.
Whether you’re a sales or supply chain leader who relies on Target’s data to make informed decisions or a sales analyst who spends countless hours in the tool, Partners Online is a valuable resource. With the ability to query over 100 metrics and generate data pulls by SKU, location, day, and more, Partners Online simplifies the process of gathering key metrics for business operations.
The portal effectively provides comprehensive data dumps on core metrics necessary for running your business. However, as those individuals who have spent their careers learning the best practices and workarounds needed to pull reports from Partners Online can attest, the portal can be complex and difficult for new users to learn. Greenfield, and Vendor IQ, in particular, are notorious for their sub-par user interfaces. Given the fast pace of modern business and the need to quickly train users, the institutional knowledge of how to effectively leverage Partners Online and its data subsets can be easily lost.
Additionally, Partners Online is not a retail analytics tool. Many retail vendors manually synthesize the data pulled from the portal in Excel to derive insights. This is a losing strategy for brands looking to stay ahead of the competition.
Why you shouldn't rely on excel to analyze your Target retail data?
Consumer brands that approach Alloy.ai often come to us because they’ve been unsuccessfully analyzing Target Partners Online data using Excel. This method of analyzing Target’s retail data can be needlessly tedious and, as we’ll discuss shortly, highly ineffective. It’s true that Excel is a flexible tool that’s good at many things, but speed isn’t one of them. The way it’s built doesn’t enable quick ad hoc analysis to answer in-depth questions or iterate on established methods of synthesizing data.
Excel also cannot handle large data sets that may be pulled from Partners Online, especially when comparing current datasets with prior data pulls. Setting up to combine multiple data adds another roadblock, one that is almost insurmountable in Excel. Combining data from various sources, such as Amazon and Target, requires ensuring that the formatting is consistent and that the data is in the same “language.” This involves translating ASINs to DPCIs or vice versa, as well as translating both into your internal SKU numbers and fiscal calendars. To perform category analysis, it is necessary to translate between the different product hierarchies, while geographic analysis entails translating Target store numbers into zip codes. Although it is feasible to accomplish this through lookup tables in Excel, the process can be a significant hassle and one prone to human error.
Relying solely on crunching numbers in Excel will likely not provide users with a comprehensive understanding of the metrics necessary for informed decision-making in inventory management, planning, and supply chain operations.
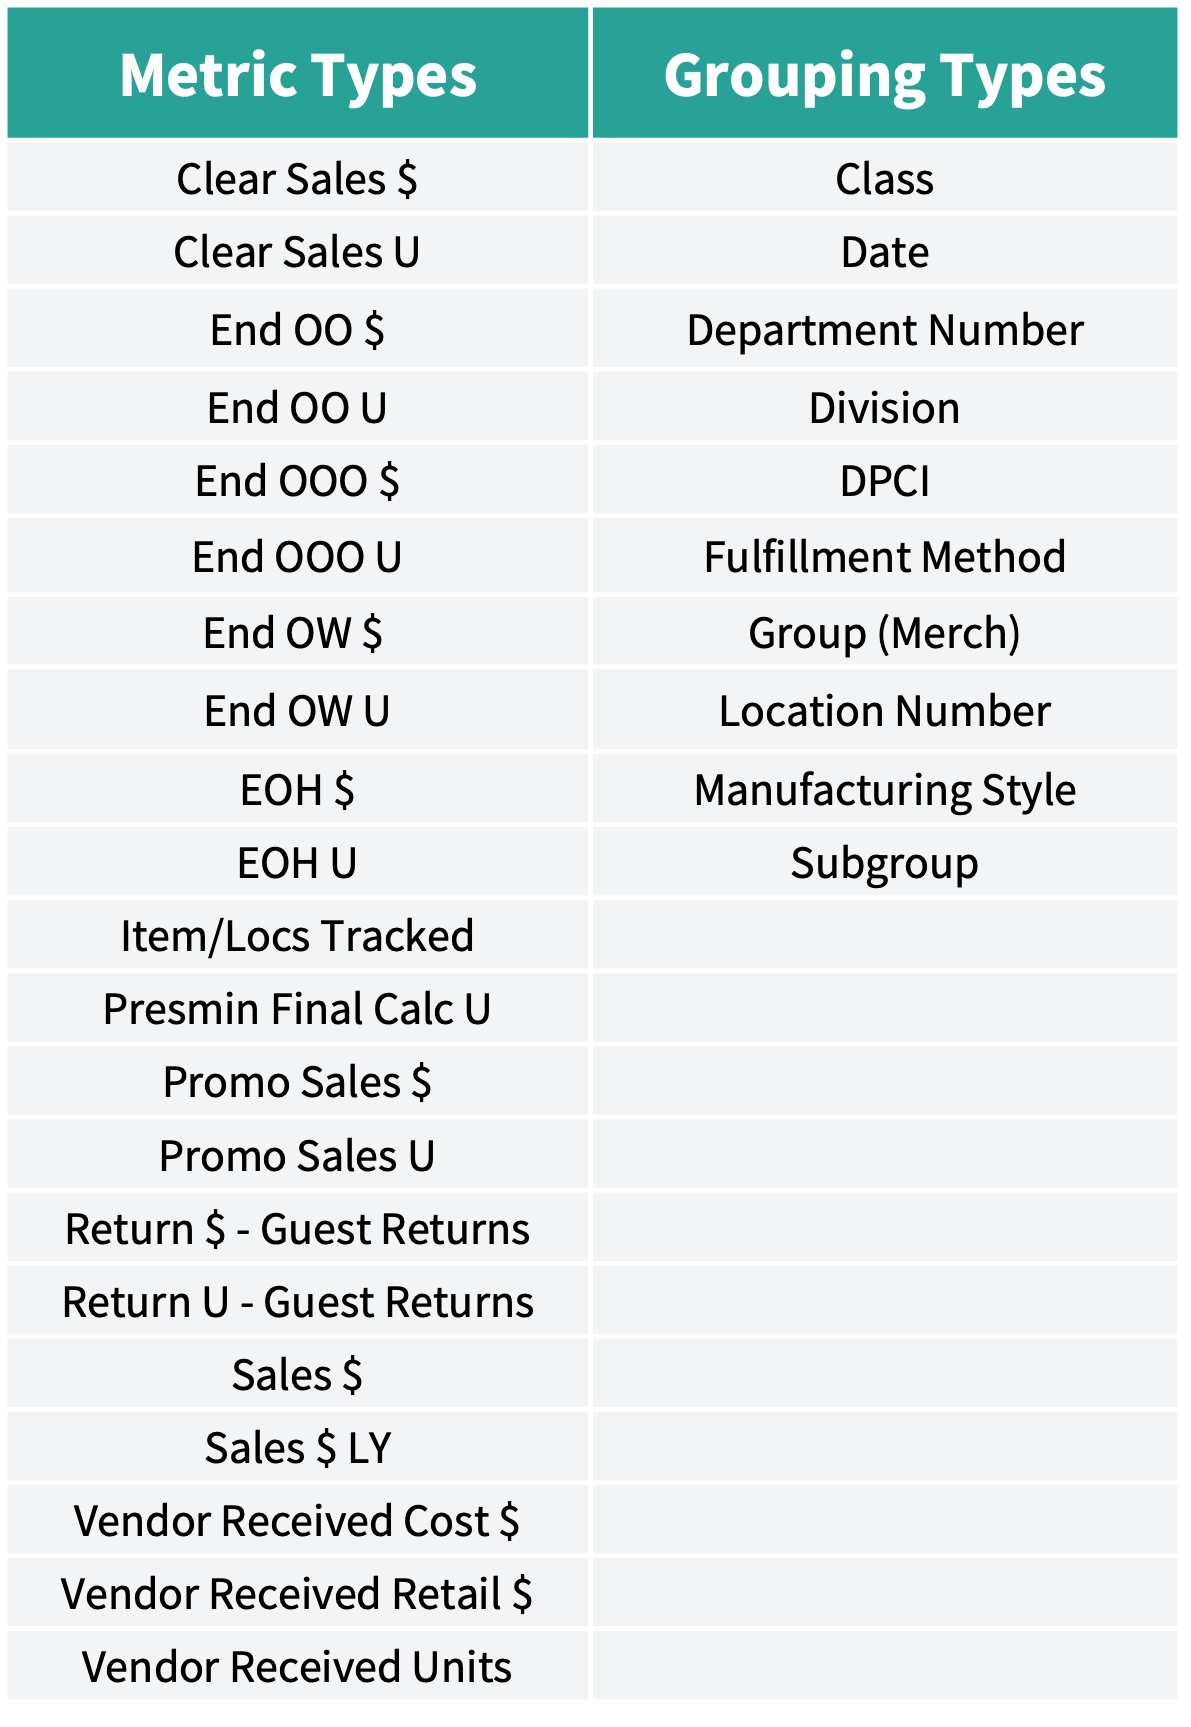
Key Target-specific retail metrics you should be analyzing
Like most major retailers, Target has a set of standardized metrics on which it reports. Brands need to be able to understand these metrics and be able to harmonize them with their own internal product identifiers, fiscal calendars and events to understand end-to-end demand and inventory. Often, derived metrics and analyses need to be put back into Target’s own language before the retailer can be approached to take action. As noted above, manually transitioning between your retailer’s metric names and product identifiers and your own can be cumbersome and time-consuming.
Below is a snapshot of the most important Target-specific metrics you need to be able to analyze. Your internal terminology is likely different for some, if not all, of these Target metric types.
Four tips to get the most out of your Target Partners Online retail data analysis
#1: Automate routine Target retail data extraction and analysis
Native, a subsidiary of Procter & Gamble, got its start as a direct-to-consumer (DTC) natural deodorant brand. Since its wildly successful expansion into Target, the company has experienced significant growth with its overall brick-and-mortar strategy.
Even with its successful launch into traditional retail, Native is still a smaller company without the resources to dedicate entire teams to extract insights from raw data, which can be a laborious process. Consequently, the brand frequently found itself needing more clarity on crucial details, including product and regional performance at Target.
To address this need, Native collaborates with Alloy.ai to improve their visibility and efficiency into Target data. From the outset, Alloy.ai’s user-friendly interface and intuitive features appealed to the company, as it did not require a team of data scientists to extract granular insights. Instead, sales and supply chain teams can quickly make informed business decisions with the help of automatically derived metrics.
Here’s how automating retail link data-pulling and analysis helps you improve efficiency:
1.1: Unlock time savings
It’s no secret that Partners Online isn’t the most user-friendly platform, and gaining a thorough understanding of your business’s health often requires the expertise of a skilled analyst.
Alloy.ai automates both the data-pulling and analysis processes so teams can save significant time each week and redirect their analysts’ attention to value-add projects and initiatives.
Instead of having a team member logging in, running manual reports, and waiting up to an hour for data to be available in Excel, Alloy.ai automatically scrapes Partners Online to generate and download configured reports. These are comprised of the most up-to-date data, with Target typically refreshing their portal daily at 8 AM PST.
Additionally, Target has its own product identifier, called a DPCI, that is assigned to each product. This product identifier is unique to Target and does not apply to other organizations, even if those organizations sell the exact same product. So a mechanism must be established to identify the same product regardless of distributor or retailer. For example, if you sell a product through Target and Walmart, Target uses the Target Manufacturing Style attribute to denote a specific product and Walmart uses Walmart ID as the product identifier. Alloy.ai matches this automatically and provides the user the ability to override any bad mappings. Harmonizing this manually in Excel is nearly impossible, Alloy.ai does it automatically.
This sort of analysis takes two clicks in Alloy.ai. See how for yourself.
Dynamic reports within Alloy.ai
#2: Get the right visualizations with the latest data
While attractive charts and graphs can be pleasing to the eye, the way in which you present your data and the frequency at which you update your visualizations is much more critical.

Data visualization in Alloy
When generating a report through Greenfield / Vendor IQ, you have a limited ability to create graphs and reports which many users find doesn’t give them enough flexibility with their data.
Excel presents a significant challenge in creating data visualizations since they are static and require manual updates. Given the fast pace of today’s business environment, such visualizations will likely be out of date by the time they circulate throughout your organization. This can lead to important decisions being made based on obsolete data by sales and supply chain leaders, as well as by executives.
The Alloy.ai data platform automatically extracts data from every retailer portal, offering real-time visibility into demand and inventory positions from the shelf to the warehouse.
#3: Find insights by drilling into the right metrics
Alloy.ai customers reduce the time they’d typically be spending pulling and visualizing data by 20%. This frees them up to spend more time here — finding insights and taking proactive and preventative action to mitigate risks and improve their bottom lines.
Our observations reveal that our vertical-leading users are closely monitoring several critical metrics. They leverage these metrics to inform their daily decisions regarding inventory management and replenishment at Target.
The advanced retail metrics that help drive your business
- ☑️ Weeks of supply
- ☑️ Future weeks of supply
- ☑️ Lost sales (at Price)
- ☑️ Lost sales (at Cost)
- ☑️ Out of stock %
- ☑️ Forecast accuracy
- ☑️ % of Forecast
- ☑️ Gross margin
- ☑️ Active locations
- ☑️ Sales per store
- ☑️ Recommended order adjustments
- ☑️ Phantom inventory
- ☑️ ROI of in-store marketing
- ☑️ OTIF
All of these derived retail metrics require hours of expert analysis by industry subject matter experts to uncover if you’re leveraging Partners Online in combination with Excel. If this is your method of operating, consider how long it would take for you to calculate the weeks of supply in a specific regional distribution center or e-commerce fulfillment center right now.
If you’re lucky, you might have a few elements needed to calculate your derived metrics, but it will take you a while to crunch the numbers and come to a static answer. With Alloy.ai, these metrics can be dynamically updated with just a few clicks as new data becomes available or as additional levels of granularity are needed to answer more specific questions.
Let’s deep-dive into a couple of these metrics to get a better understanding of how they might be used by Target-focused teams at a consumer goods brand.
Arguing for increased WOS based on OOS% and Lost Sales metrics
Many of Alloy.ai’s customers track out-of-stocks by product on a routine basis. With regular reporting, sales teams can see which of their products are consistently out of stock, and therefore contributing to lost sales. When a product consistently has lost sales, but standard manufacturing and logistics issues have been ruled out, sales teams need to take a closer look at the data to pinpoint the root cause of the issue.
Frequently, lost sales due to high OOS percentages can be attributed to low presentation minimums, and therefore, order minimums. In a nutshell, Target’s automated buying system simply might not be ordering enough product to meet demand because of a predetermined assumption of what the inventory levels should be. If you believe that there is a correlation between reorder points and lost sales, you need data to back up your theory before going to your buyer.
Using the tailor-made metrics and intuitive dashboards built into Alloy.ai, users can be alerted to low inventories and most costly out-of-stocks in near real time. From there, users can easily track OOS%, lost sales, and inventories over a specified period of time for the SKU in question. Armed with this data and visualization, brands are then able to persuade Target to more aggressively replenish stores or order more product to mitigate lost sales.
“Alloy.ai has enabled conversations with major global retailers — whether it be Target, Walmart. They now have visibility much sooner than what it shows in their system […] We’re talking to retail partners and saying, ‘Here are the trends that we’re seeing. Here’s what you chase. Here’s what you don’t chase.’ It unlocks a different type of partnership.“
– Dave Henderson, Chief Commercial Officer, Melissa & Doug
Evaluating marketing spend with Sales Trends and A/B testing
Consumer brands often allocate significant marketing budgets to drive sales both in brick-and-mortar stores and through e-commerce channels. However, measuring the return on investment (ROI) of these marketing activities can be challenging. Alloy.ai has a dedicated workflow called Experiments that offers a solution by providing real-time measurement of every marketing activity, enabling brands to continually assess their investments and focus on what works.
With Alloy.ai, brands can easily analyze real-time point-of-sale (POS) data at the store and SKU level. This means they can compare data from stores or zip codes that received investment with those that did not. By using a simple A/B analysis with a test group and a control group, they can measure the statistical impact of each marketing and sales activity and keep track of sales trends for specific products. This includes analyzing the effectiveness of promotions, events, end-caps, field sales visits, regional advertising, and more. Ultimately, this helps brands identify successful strategies to focus on and eliminate ineffective ones.
“Rather than doing kind of a general, national campaign for marketing, we’re really able to use Alloy.ai data to divert and reallocate spend to really focus on the areas where we don’t have as much sales.“
– VP of Marketing, Native
#4: Focus only on the areas where you need to take action
Partners Online provides a wealth of data points that can be overwhelming to navigate. When selling through a retailer like Target, utilizing alerts is crucial.
By managing by exception, potential problem areas can be quickly identified and addressed. For example, if the out-of-stock (OOS) rate for a certain SKU jumps from the normal 1% to 7%, a trigger can be configured in Alloy.ai to send an email report highlighting the issue. This allows for immediate attention to be taken on the specific area in need.
Attempting to do this in Excel would require sifting through numerous SKUs and locations, a time-consuming and inefficient task. In contrast, Alloy.ai simplifies the process of building alerts, whether it’s for in-stock rates, phantom inventory, excess inventory, performance vs. plan, or any other metric that requires close monitoring.
To see how easy it is to build alerts in Alloy.ai, check out the video below:
See it in action: Out of stock detection and resolution in Alloy.ai
What if you’re selling through multiple retailers?
The complexity discussed above is relevant when you’re working as a dedicated Target team and selling exclusively to one retailer.
Now, envision the immense complexity that arises when you introduce dozens or even hundreds of retailers into the equation. If you’re manually navigating through each isolated portal, you’re wasting valuable time that could be better utilized in searching for actionable insights to drive more sales.
Having the ability to compare performance metrics across various retailers, without the need for manual report generation, can revolutionize the game for many brands.
Our customers have discovered that analyzing data across different retailers yields insights that would otherwise be elusive. For instance, you might observe success with a particular SKU at Target but not at Walmart or Amazon. What could be the underlying cause? Is it a demographic variation? Is Target employing specific promotional strategies that can be applied to other retailers to boost sales there?
These are the types of inquiries our customers tackle daily with their data, and they lead to invaluable insights that are exceedingly challenging to obtain if you’re confined to portals and spreadsheets.
To learn more about how to uncover deeper insights with Retail Analytics read our buyer’s guide.