
Introduction
I started to write a “Demand Forecasting 101” article but decided that was going to turn into another Ph.D. thesis, so instead I wrote this. This is a list of things that I learned about demand forecasting early in my career – things that would have been nice to know from day one. More important, they are things that my clients have found valuable to discuss at the outset of projects. This is particularly true for those new to enterprise demand forecasting, but I believe the list serves as a valuable refresher course even for seasoned pros.
Note, I’ve heard some people say that AI has changed everything and renders much of what we know about forecasting obsolete. AI is certainly a breakthrough technology that is improving demand forecasting – and is one of the reasons I started my company, NewHorizon.ai. But this list is agnostic of the particular forecasting technology used.
Along those lines, I suggest the 1971 Harvard Business Review article, How to Choose the Right Forecasting Technique. That is not a typo — 1971. This is one of the most widely referenced articles in the domain of business forecasting and comes up second if you Google “forecasting.” While new techniques have been developed and forecasting has been revolutionized by computers and now AI over the last half century, certain basic principles are timeless.
Now here’s my list:
1. Don’t Confuse Demand Forecasting with Demand Planning
The two terms are often used interchangeably, and this is often a source of confusion. Forecasting is a subset – a very important subset – of demand planning. Demand planning refers to the broader process of not just creating forecasts but turning them into enterprise plans and includes things like sharing the forecast with dozens or hundreds of users; collaborating and reaching consensus among different departments and with customers; reviewing, editing, and approving forecasts; and allocating demand for products in short supply. This list focuses on the narrower topic of forecasting.
2. Demand Forecasting Is Not Just a Supply Chain Process
The supply chain department of every organization can have a big impact on other functions, affecting whether sales and marketing can hit their revenue targets and whether finance can hit their revenue, cost, and profit goals. This is particularly true for demand forecasting. Forecasting is the key link between the supply chain group and other functional areas. Forecasting is where expectations of market demand are translated to operations so that they can meet this demand and generate revenue. Accordingly, forecasting must be a collaborative process among different functional areas. In fact, demand planning sometimes sits within the sales or marketing organizations or is even a freestanding group in some companies.
3. Forecast Accuracy Is Not a Good Way to Measure Forecasting Effectiveness
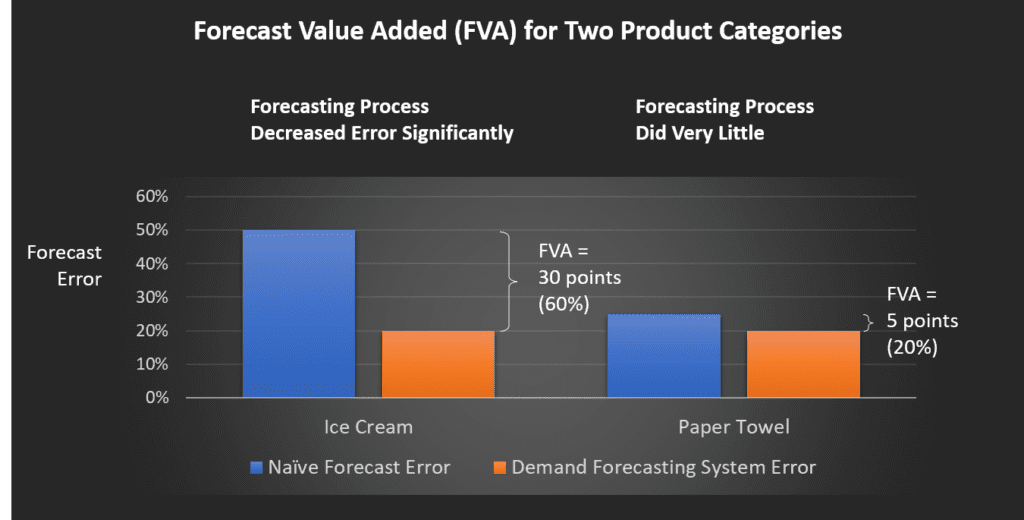
Let’s say you sell two different types of products, and both have an average forecast error of 20%. Many people would say the demand forecasting team did an equal job of forecasting the two categories. But it may be that one of the products is fundamentally more difficult to forecast because of the nature of the product or the go-to-market strategy. For instance, a staple category like paper towels, with a limited set of competitors, is far easier to forecast than a discretionary category such as ice cream, with lots of competitors, new products, and demand highly dependent on promotions and warm weather.
So to evaluate the effectiveness of your forecasting process, instead of looking at forecast accuracy, you should look at the extent to which you’ve improved it over the relevant baseline. This is known as forecast value added (FVA) and is a measure of the value your forecasting process is providing above and beyond the baseline. The baseline is the so-called naïve forecast, the forecast resulting from a simple forecasting method (such as using a moving average of prior demand) one would use in the absence of a more sophisticated forecasting process. In the chart below for a hypothetical company that makes paper towels and ice cream, we see that the forecasting process was much more effective for ice cream because it decreased forecast error by 60%, whereas for paper towels, it decreased error by only 20%.
4. Forecast Bias Is a Measure of Organizational Dysfunction
We often talk about forecast error and bias as the two primary measures of forecast accuracy. For those unfamiliar with these measures, the most common forecast error metric is mean absolute percent error (MAPE), typically defined as the absolute value of (Forecast-Actual) / Actual. MAPE measures how far off you are from the actual value, but does not distinguish between forecasting too high or too low.
Bias, on the other hand, aims to capture whether you are consistently forecasting too high or too low and is calculated by dividing the difference between total forecasts and actuals by total actuals. Ideally your bias will be zero, meaning your forecast error is random and you are as likely to forecast too high as too low. A non-zero bias means you are systematically over or under-forecasting. This is generally not the result of a problem with your forecasting techniques. It is more likely some type of dysfunctional organizational behavior, such as increasing the forecast to avoid stockouts — a noble goal, but one that should be achieved through inventory policies, not by doctoring the forecast. So bias is best thought of as a measure of the quality of your organizational consensus forecasting process.
5. There’s No Right Forecasting Level
When you forecast, you will need to choose what level to forecast at, e.g., item vs. product family, DC vs. store, day vs. week. If the logistics group needs to deliver specific items to specific stores daily, they need a forecast at that level. Likewise, if the sales and operations planning team wants to plan long-term capacity needs, a forecast by product family, month, and factory is more appropriate. Forecasts need to be available at different levels for different business needs. There shouldn’t be a single level for everyone.
Note, the more aggregate the level, the more accurate the forecast, because positive and negative errors at a more granular level cancel each other out. That’s good news if you just need an aggregate forecast, but beware the temptation to set too aggregate a level of forecasting to make your accuracy look better. I’ve seen forecasting groups take that approach for reasons of company politics, but it’s a recipe for poor supply chain performance.
For more on this topic, see my blog post, Corporate Politics And The Right Forecast Level For Planning.’
6. Beware Forecast Comparisons
This is a corollary to the previous item. Forecasts exist at different levels for different use cases, but since forecast accuracy improves with the level of aggregation, you can’t compare forecasts at different levels, whether within a company or between companies. Nevertheless, I’ve seen people talk about how good their 5% forecast error is at the product family, national, and quarterly level compared to someone else’s 30% forecast accuracy done at the item, DC, and week level. This is an apples to oranges comparison.
7. Time Series and Causal Forecasting and AI, Oh My!
There are two general classes of statistical forecasting techniques traditionally used in enterprise demand planning applications: time-series forecasting and causal forecasting. New AI approaches have emerged in the last decade. As with any technical subject, these terms can be confusing and are often misused for marketing purposes. Here’s my attempt to set the record straight:
Time-series forecasting refers to projecting the value of a variable such as sales, solely based on the historic values of that variable. So if you have a few years of sales data, various time-series algorithms can detect some combination of overall trend, seasonality, and irregular cyclical patterns and use that to project the future value. Such techniques do not take into account external factors such as weather or marketing promotions. Example time-series algorithms include Holt-Winters and ARIMA (Autoregressive Integrated Moving Average), to name just a couple.
Causal forecasting, on the other hand, looks at how factors other than the forecast variable itself, such as weather and promotions, affect the forecast variable. So to do causal forecasting, you need additional data streams besides the variable you are forecasting. Various types of regression analysis are commonly used for causal forecasting. Many casual forecasting algorithms include an element of time-series forecasting, so they are in fact a hybrid of the pure time series and causal approaches.
I’ve seen vendors of AI-based forecasting technologies claim that traditional forecasting applications use time-series forecasting exclusively and that AI is required to take into account causal factors. This is not true; causal forecasting algorithms have been commercially available for decades.
But AI allows you to do a better job of causal forecasting. The most common form of AI applied to forecasting is machine learning (and is what my company uses). Machine learning generally considers a larger set of data than traditional techniques and can discover correlations that a human forecaster might not even consider with a traditional algorithm. It also “learns” by examining data, making predictions, comparing those predictions with actual results, and then automatically tweaking the algorithms to continuously improve predictive accuracy. Thus AI improves upon traditional techniques. For more on AI, see my article, Primer: Artificial Intelligence for Demand Forecasting.
8. You Need to Learn How to Deal with Bad Data
Many discussions of forecasting techniques assume you have perfect data. This assumption is not reflective of reality. In practice, demand data is messy. Outliers are common — data that doesn’t fit the predominant pattern and can’t be explained, either because of an error or some root cause not captured by the existing data. Outliers must be removed to avoid distorting forecast results. Often data is missing for various reasons, and this can further confuse forecasting models. Special algorithms are needed to take into account such missing data.
Then there is the issue of hidden demand. This occurs when demand (as measured by orders, shipments, or retail sales) is depressed or zero because a product was out of stock. Such hidden demand does not represent an error in the data like the above two cases, but rather an inability to measure what demand would have been had the product been available to purchase. Again, special algorithms are required to account for such hidden demand if you want to be able to meet this demand in the future and maximize sales.
9. Don’t Confuse Turn and Promoted Volume with Base and Promotion Lift
These last two items relate to promotions, which are most relevant to the consumer products and retail industries. I’m including them in this list because promotions account for a huge portion of volume in these industries, and forecasting promotion effects is a major focus of forecasting teams.
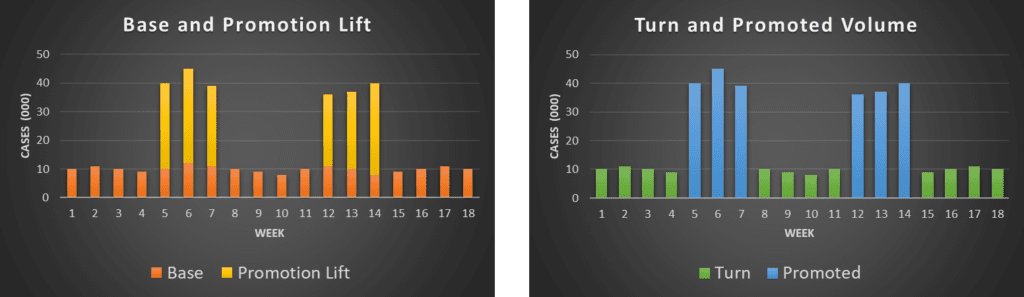
Companies use two different frameworks for talking about promotion volume, and this can cause some confusion. Consider a product that is being promoted in weeks 5–7 and again in weeks 12–14. In the below chart on the left, we show Base in orange, the volume that would have sold in the absence of any promotion. Promotion Lift, in yellow, is the incremental volume attributed to the promotion. This decomposition of volume into base and lift reflects the use of a causal forecasting model which statistically infers what portion of the total volume was caused by the promotion vs. what amount would have been sold in the absence of the promotion.
On the right, we show the same data, but this time using a different framework. Turn (green) is the volume in non-promoted weeks, while Promoted Volume (blue) is the volume during promoted weeks. The Promoted Volume does not make a distinction between what you would have normally sold and the incremental amount caused by the promotion. We are simply showing how much volume was sold during the promoted and non-promoted periods.
Both these frameworks are valid but are used for different purposes. The base/lift framework is useful for attributing incremental volume to promotions (and thus measuring promotion impact and ROI). The turn/promoted framework is useful for understanding what portion of your volume is sold during promotions, a measure of the promotion intensity of your business.
10. Promotions Are Going to Cause More Trouble Than You Think
While we’re on the topic of promotions, I want to point out how promotions have effects beyond the intended promotion. When a company promotes a product, the intent is to increase sales of that product in a specific location for a specific period. However, such a promotion has effects on other products, locations, and periods. Consider the example of Utz Brands, marketer of Utz® snack foods and On the Border® dips and salsas. If Utz promotes their tortilla chips at the Kroger supermarkets in a certain region in week 10, such a promotion could have the following indirect effects:
- Cannibalization: The tortilla chip promotion could cannibalize sales of Utz potato chips and other snack products.
- Halo Effects: The tortilla chip promotion could have a halo effect (increase sales) on On the Border salsa and other dips.
- Cherry-Picking: The tortilla chip promotion at Kroger could decrease Utz and other tortilla chip sales at other supermarkets in the area, as some consumers forego tortilla chip purchases at their regular store and buy them at Kroger instead.
- Pantry Loading: The tortilla chip promotion in Week 10 could depress tortilla chip sales in the weeks before and after week 10, as some consumers stock up during the promotion week.
- Forward Buying and Diverting: A similar dynamic to the above could happen at the wholesale level. Kroger could reduce purchases before and after the promotion and engage in forward buying, that is, stocking up on tortilla chips on deal to supply their future retail demand (beyond what they need to meet consumer demand during the promotion period). They could buy even more on deal to divert the product to sell at a profit to other retailers in other parts of the country where Kroger doesn’t compete.
These indirect effects can have a sizable impact on your supply chain, one that may catch you by surprise if you don’t plan for them.
Conclusion
There you have it – my top ten list. I often review some or all of these items with client teams at the outset of a project, depending on their experience level, their industry, and the specifics of their business.
To Learn More
To learn how New Horizon can help you with your forecasting challenges, please contact us – we’d love to talk.