In a recent blog post, I was challenged by Anna. She wrote, “I have been working in the supply chain for 35 years, and we are still trying to solve the “demand” issue. Solving from a supply side seems to work for many companies I work with. Given your expertise, I’d love to hear what alternatives you recommend for better demand forecasting and real-time visibility beyond what’s commonly adopted today.” Anna, this blog post is for you. I know that your primary focus is procurement.
Over the last two years, I actively engaged technologists and business leaders to redefine demand planning. Unfortunately, the industry is full of a lot of Anna(s) and her friends, the doubting Thomas (s). In the industry, supply-centric techniques reign with lots of bravado and messaging on control towers, Demand-driven Materials Requirements Planning (DDMRP), and generative AI.
As a side note, I struggle to count the ” experts” on S&OP. Don’t you find the number of “experts in S&OP” a bit humorous? If S&OP efforts were that effective, don’t you think that we would have made more progress against inventory levels, margin, and growth? I firmly believe that the issues of alignment and functional metrics make S&OP an activity of futility for the global manufacturer. Only 2% of companies are pushing forward in our Supply Chains to Admire analysis. The issues are largely rooted in politics and the lack of clarity on supply chain excellence.
Regional companies outperform global brands in all but two industries in the market. The Companies with the greatest success are smaller and usually drive product innovation into the market. (Clear mission.) Global companies with stable brands struggle to drive improvement, but ironically, we speak of best practices.
By and Large, The Bullwhip Whipped Us
The bullwhip effect is a supply chain phenomenon where orders to suppliers tend to have a larger variability than sales to buyers, which results in an amplified demand variability upstream. In part, this results in increasing swings in inventory in response to shifts in consumer demand as one moves further up the supply chain.
The Beer Game (which most supply chain leaders have played) was developed by Jay Forrester in 1961 as part of his work in Industrial Dynamics (1961) at MIT. The goal was to teach the impact of system dynamics in a non-linear system that we now call the supply chain. Much like cracking a whip, a small channel demand flick is amplified through supply processes. Testing shows that in today’s global supply chain, the amplification and distortion is over 200%. However, few measure it, and no technology is available to drive a learning engine to minimize the bullwhip impact. For LKQ Europe, as shown in Figure 1, testing on brake pad distribution showed that the bullwhip effect was 48% between channel demand and the customer order. The reason? The distribution models were never tested when implemented. As a result, after four years of the initial go-live, the team blindly used planning models, distorting the plan.
Figure 1. Bullwhip Effect at LKQ Europe Summer 2022 Testing
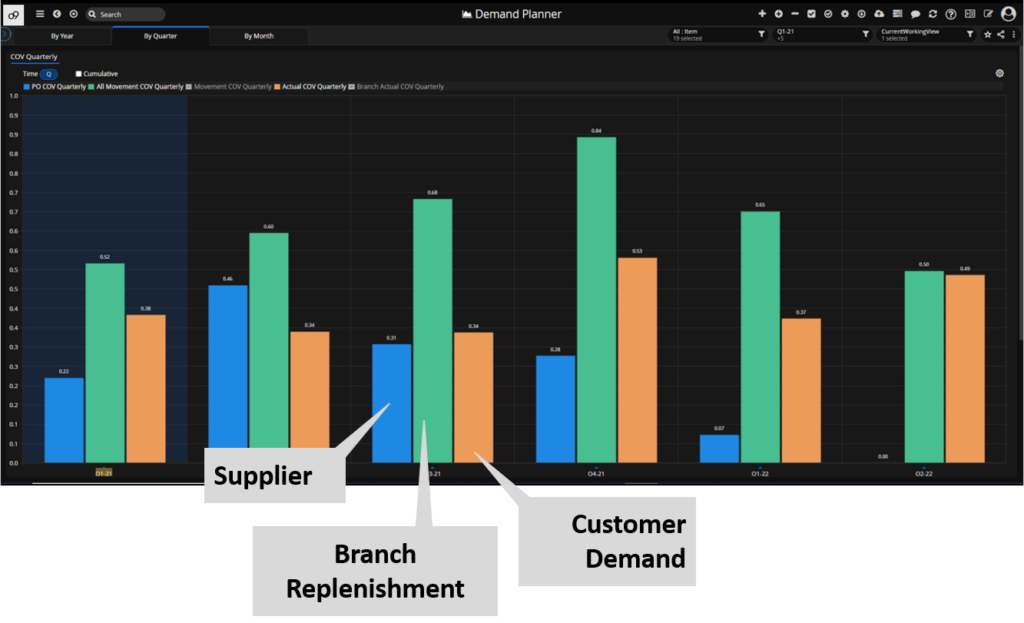
So, why do we not measure the bullwhip effect? And how do we measure it? (Is a comparison of COV of channel demand versus orders sufficient? Or a similar comparison of customer orders or planned orders? Or planned orders to purchase orders?) Why do we not measure it as a part of standard implementation? I don’t know.
I often observe companies using the beer game as an educational tool or as a social networking activity. In the sessions, the learning is intense and profound. However, the action taken is inconsistent with the learning. Most of the time, implementing Advanced Planning Systems (APS), Enterprise Resource Planning (ERP), and Supplier Relationship Management (SRM) increases the bullwhip impact. The reason? The technologies perpetuate demand linearly using the order as a proxy for demand. The supply chain is a complex, non-linear system that cannot be effectively managed linearly. The larger the company, the greater the non-linearity.
Which brings me back to Anna. She is a disbeliever. Most of the industry is composed of doubting Thomas(s). The testing will take time. Similarly, groups still believe that the world is flat even though Pythagoras in the 6th century BC and Parmenides in the 5th century BC determined that the earth was a sphere. Each space shot shows the Earth as an orb. There will always be Anna(s). I just hope that through my work that I can convince a few of them to be believers in an outside-in approach.
Testing Of Outside-in Processes
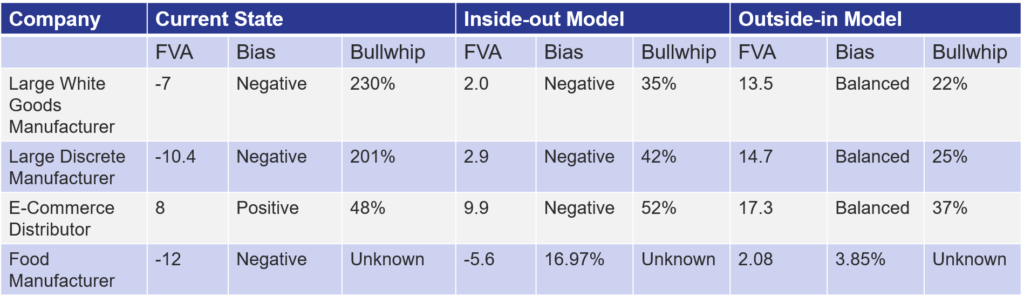
Using channel and market data and redefining demand planning from time-phased data to flow improves the FVA by 10%, removes bias, and decreases the bullwhip by at least 50%. Should companies care? I think so. Do they? It is hard to change an industry.
The data encapsulated in Table 1 represents two years of testing with APS providers. Each of these tests took 3-4 months to analyze the data, train the teams, and test market factors. The model development was quick after aligning the demand flow output using a graph-based model with five to six market factors as input.
Table 1. Results of Two Years of Testing Outside-in Demand Management Approaches
Lessons Learned
My learnings are many. Here are seven to ponder:
- Groupthink. Changing an industry is tough. I question why the industry chases shiny objects like control towers, generative AI, and DDMRP but is reluctant to use the WEB 2.0 technologies of the graph, NoSQL, ontological deep learning, machine learning, or unstructured text mining to map market and channel signals t redefine demand. Companies are so stuck in their thinking of SKU logic on relational database models to yield a time-phased forecast to be consumed that the concept of demand flow based on multiple factors is hard to conceive. Just ask Anna. The unfortunate answer is groupthink.
- False Belief in Current Systems. Most companies believe that they are improving demand signals with current deployments, but they are not. In the testing, three of the four companies deployed the wrong model, which degraded the demand signal with a negative FVA. (I find 80-90% of companies are degrading the forecast through traditional thinking.) Using FVA and calculating the bullwhip effect helps companies understand how to drive improvement. I encourage all to backcast to test and improve their models. Don’t limit your thinking to only the optimizers. Instead, rethink the models and the approach. To accomplish this, make a date with your planning technology provider. I struggle to find any consultants who are experienced enough with demand modeling to help. Go to the source. Test, refine, and then drive improvements.
- An Outside-in Model Beats an Inside-Out Model Every Time. I laugh when I watch the current APS demand planning technologists scrap it out at a manufacturing site, with each trying to prove they have a better optimizer. In each case, the change in the optimizer from one technology to another had little impact on the inside-out model. The greatest improvement happened with the use of outside-in data and the transformation from time-phased data consumption to flow management.
- Data Everywhere, Insights Are Few. In one of the case studies, a manufacturer reported that they had 1700 employees with the term “data” in their title, but they lacked insights. This is despite the deployment of ERP, descriptive analytics, APS, SRM, and teams of data scientists working on their data lakes. In each test, supply chain teams were amazed to find data that they did not know existed. The data owned by the company was not only unused but incredibly valuable. I encourage all to explore the data available and how to drive insights. (Set up a time for digital marketing teams, data scientists, sales account teams, and supply chain groups to brainstorm on using various data sources to improve the models. Explore rating/review data, weather and event insights, channel data, field images, and unstructured text mining by brokers/customers/distributors.)
- So What? Who Cares? Push the FVA and Bullwhip factors pre and post-testing into a network design model to understand the impact on customer service, inventory policy, and margin. Use the visualization in network design models to educate teams on why they should care. Conventional models believed to be “best practice” increase cost and inventory while distorting customer reliability more than most teams understand. Use the network design models to assess the market potential.
- Change Your Relationship With Demand Planning. Focus less on the error and more on improving your company’s potential. Measure FVA, the bullwhip effect, and demand latency and try to change the discussions to drive improvement. While you should continue to measure error and bias, focus more on MPE and fire the APEs (MAPE, WMAPE, etc.).
- Make a Date with Your Supply Chain Planning Technology to Test and Learn with Outside-in Models. A decrease of 10% FVA is a gift. Measure and understand the impact of using only orders and shipments to forecast demand and build outside-in models to decrease the signal latency while improving the FVA and bullwhip effect.
What Is An Outside-in Model?
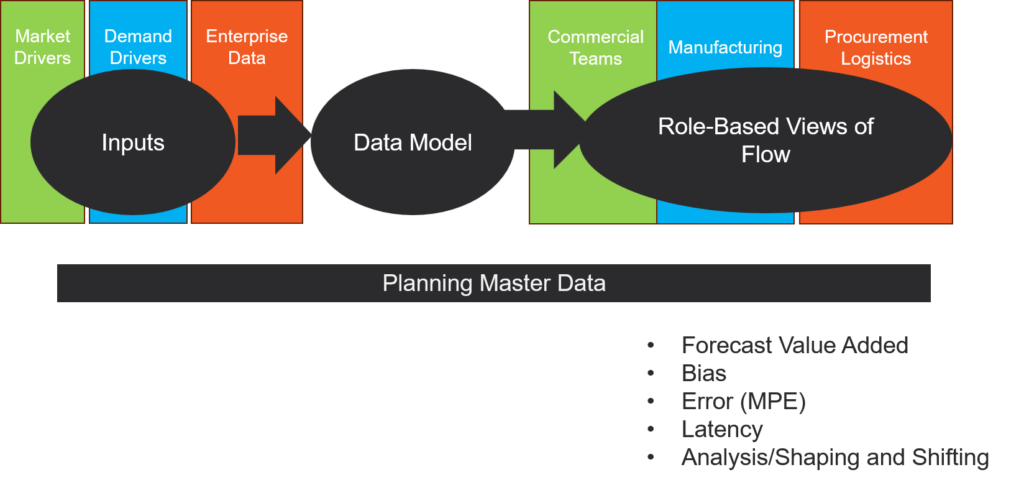
An outside-in model uses market drivers and demand drivers to predict demand. Traditional demand planning is based on pattern recognition of orders/shipments. The order is a poor proxy for demand due to the bullwhip effect and demand latency. The building of outside-in models enables the visualization of channel data with minimal latency and distortion. The use of the graph enables the visualization of flow. For the adventurous, it also enables the redefinition of work. Using new forms of analytics, the planners become orchestrators, and the planning data becomes self-service by business leaders. (Reduces political bias by aligning to balance sheet metrics. And enables self-service what-if analysis for collaboration.)
Figure 2. Outside-in Models
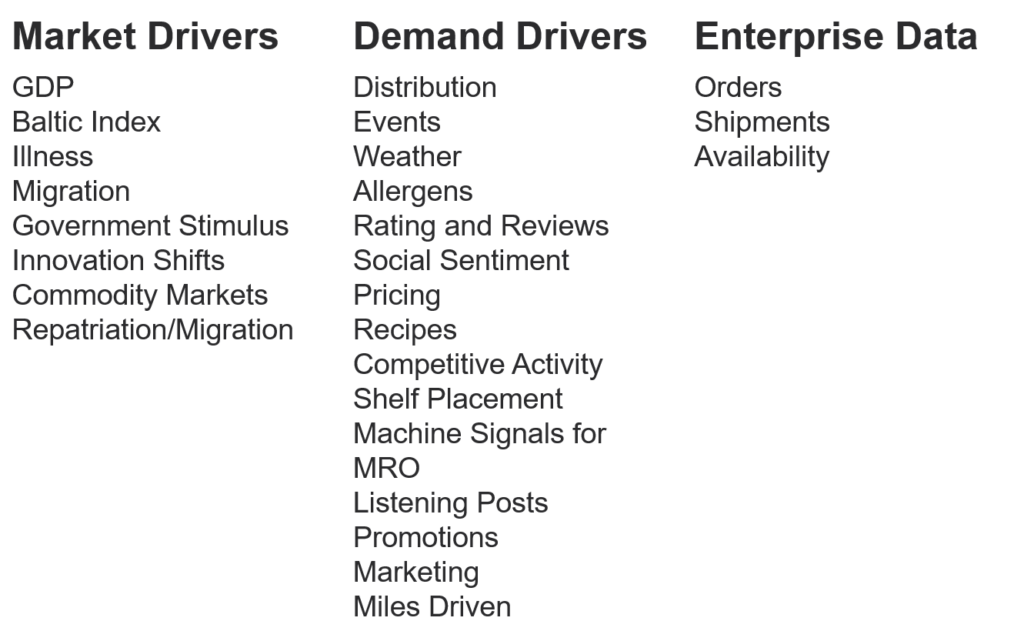
To start the process, brainstorm as a team on the appropriate data to start the testing. Select 5-20 variables to begin the modeling. The list in Figure 3 is a starting point.
Market drivers are the macro-economic factors affecting market demand while demand drivers are more immediate and includes the levers that are within the control of sales and marketing programs.
Figure 3. Market and Demand Drivers
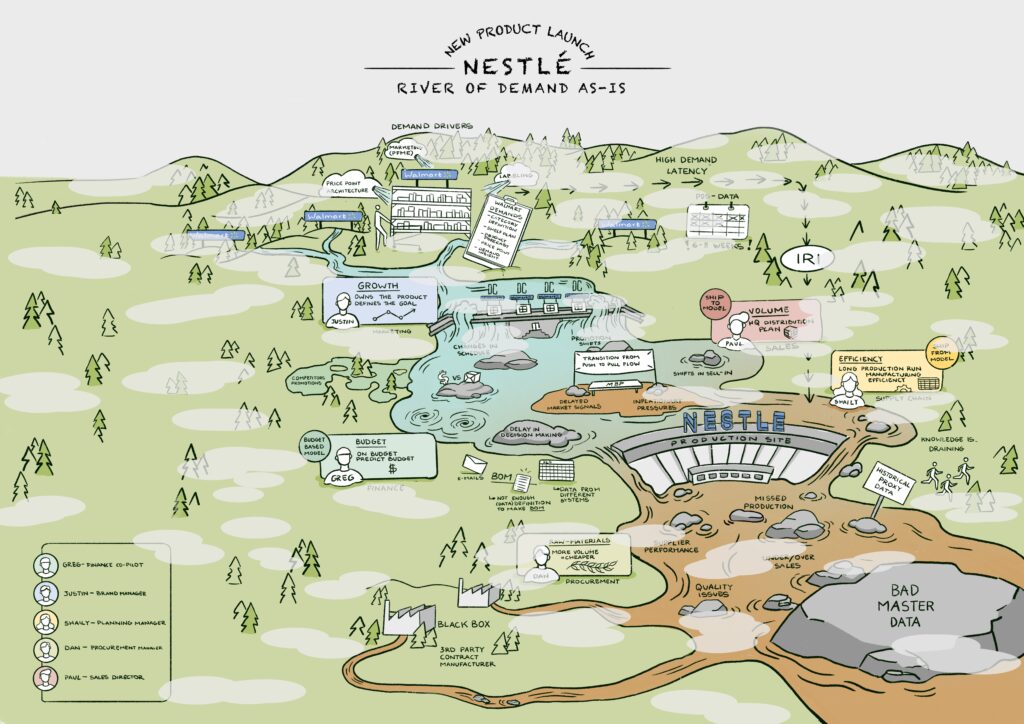
Change the paradigm to think about demand as a flow. An effective technique to use in the exploration of an outside-in model is to draw demand as a river. The flow starts in the channel and moves across commercial teams. Where the channel data is clear, draw the river as blue, and where insights are few, the water becomes murky and brown. Doing this with your employees allows you to discuss the issues and the available data while exploring the obstacles. In Figure 4, I share the Nestle demand flow for new product launch that was developed in the Project Spark initiative with OMP.
Figure 4. Nestle River of Demand in Project Spark
For success, create a safe space for the business planners to test and learn with the technologists. Don’t restrict the project by artificial goals, ROI targets, and timelines. Build a cross-functional group to tackle the work: invite the digital marketing teams, data scientists, sales operations, sales teams, and market insights backgrounds. The work will take time.
Wrap-Up
This testing and model development type is hard work but worth it. If you are at the North American CSCMP conference, stop by and listen to the story of Nicole Miera from LKQ and Margo Cohen from Nestle. Listen and learn. Then form your own opinions. Even the Doubting Thomas(s) should be impressed by the results.
Let me know your thoughts. I will not be there.