
In 2016, we finished a study on continuous improvement. When I started this research project, I was busy. The survey was one of many, and I found the project relatively nondescript, bordering on boring. One of my lessons learned in completing survey-based research over the past twelve years, is that projects are full of surprises. The hypothesis that seems so right are often wrong, and surprises lay in each nook and cranny. The more you dig, the more you learn.
In the study, when we asked for the top elements of business pain to drive continuous improvement for companies greater than 5B$ in annual revenue, as shown in Figure 1, we found the largest issues with cross-functional alignment and availability of talent. In follow-up qualitative interviews, one of the largest issues with organizational alignment was metric definition and a clear definition of supply chain excellence.
Figure 1. Top Five Elements of Business Pain for Companies Larger than 5B$ Attempting to Drive Continuous Improvement
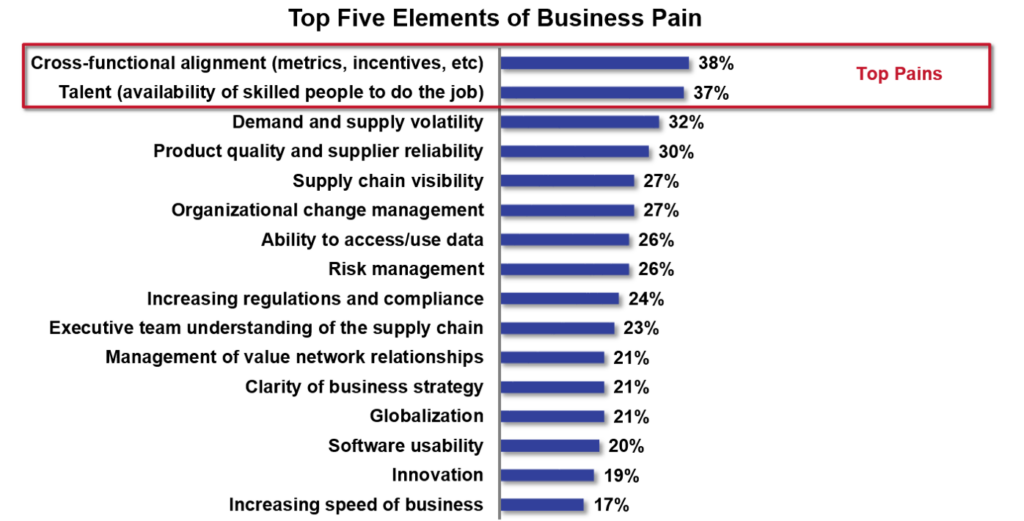
Most continuous improvement programs are managed in isolation. In the survey, companies had over one hundred active continuous improvement programs. Alignment of the programs was an issue. For example, a cost improvement in one function could raise the costs in another.
To manage continuous improvement, companies need a clear definition of excellence and organizational alignment to that goal.
What Drives Value?
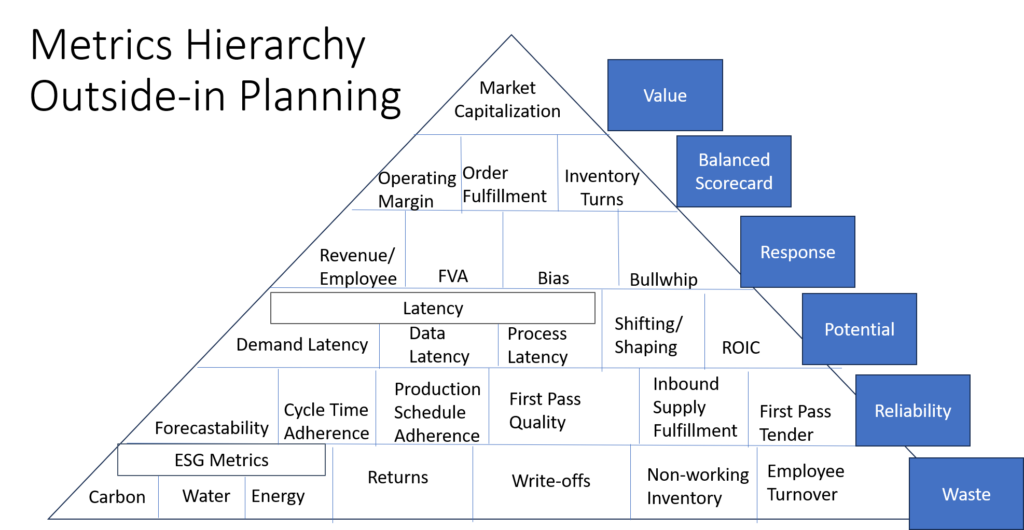
In my post Mea Culpa, I reference my work with the Gartner Supply Chain Hierarchy of Metrics. When I was an analyst at AMR Research (purchased by Gartner in 2010), I used the framework shown in Figure 2, as a framework to discuss supply chain excellence. The framework assumes that improvement in forecast error drives order reliability and a reduction in cost.
Figure 2: AMR Research Hierarchy of Metrics First Published in 2005
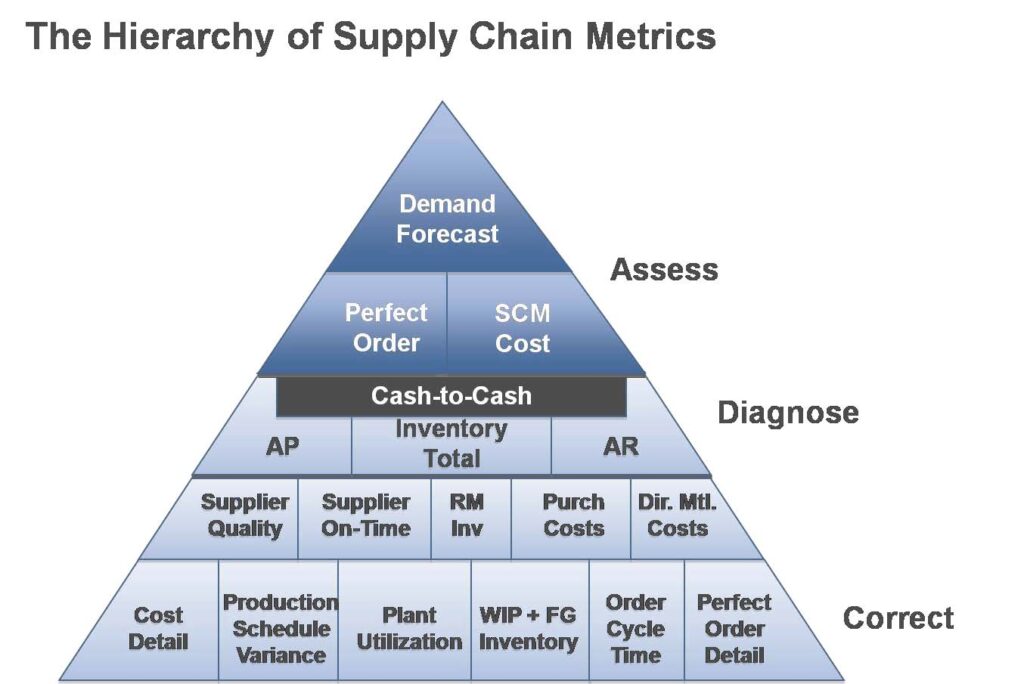
Demand error is at the top of the Gartner hierarchy. The assumption is that an improvement in error translates to improvement in customer service and cost.
So, you might say, “What is the issue, Lora?”
Let’s face it all supply chains have error. Error is error, but is it the most important metric?
The Forecast Value Added (FVA) methodology helps companies understand if they are making the forecast error better or worse than the naive forecast. (Follow the link to understand how to establish the naive forecast.)
In eight out of ten clients that I work with, I find current processes degrading the forecast. In addition, an increasing number of items are not forecastable. While changes in models (bottoms up and tops down forecasting, attribute-based modeling, and attach rate/platform modeling) can help, the problem is that even shifts in modeling techniques often do not help.
I could prattle on and on, but my point of view is that error is not the most important supply chain metric. I also believe that we need to shift from a focus on cost to maximize value. Value is maximized when companies are aligned to market requirements and maximizing customer value. Operationally, this requires a balanced scorecard.
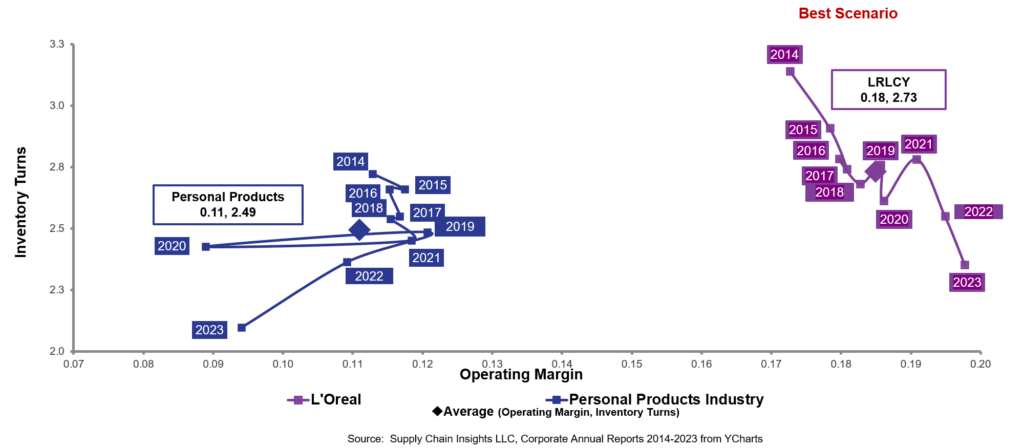
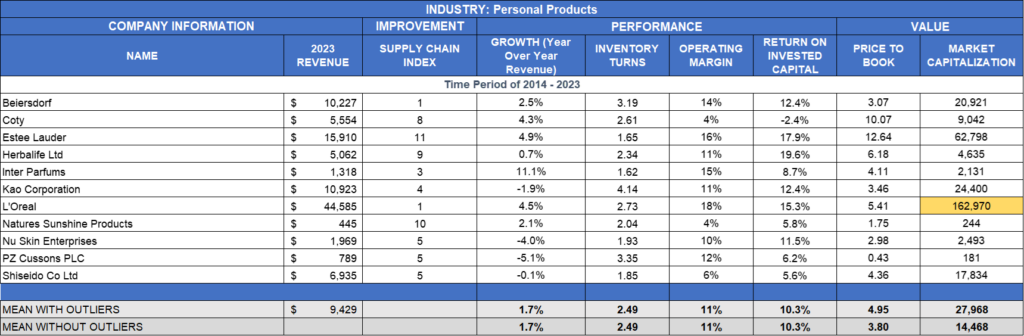
Consider L’Oreal. Anyone that has worked with L’Oreal, knows that the secret sauce at L’Oreal is the focus on beauty. They do not excel in planning or forecasting. In fact, Estee Lauder has just finished an elaborate deployment of supply chain planning yet is not driving improvement faster than their peer group. Note that L’Oreal is driving a faster level of improvement and market capitalization than Estee. Evaluate the performance of L’Oreal against peer group in Figures 3A and 3B.
One of the things that I wrestle with is that the winners of the Supply Chains to Admire do not perform better than their peer groups at planning (based on observation and work with clients). Yet, they outperform on market capitalization. Does this mean that planning is not important?
My answer is no. I think that we are focusing on the wrong metrics. Organizations are not aligned because of the focus of planners to optimize functional metrics. Functional metrics throw the supply chain out of balance.
Figures 3A and 3B: Performance of L’Oreal Compared to Peer Group
Rethinking Metrics
In concert with statisticians at Georgia Tech, we have tested correlations between different value metrics (market capitalization, fundamental score, and book to assets) and balance sheet/P&L data for public companies from 1982 to 2023. In Figure 4, I combine the insights from this research along with the testing on outside-in processes.
Market capitalization (number of shares outstanding priced by the market) is at the top of the hierarchy. Operating margin, inventory turns, and revenue/employee translates to over 50% of market capitalization based on the regression analysis. The rest of the hierarchy supports the delivery of value. The definitions are at the bottom of this blog.
Note that this hierarchy is still a work in progress. I welcome feedback.
Summary
Driving continuous improvement requires a clear definition of value.
The problems are many. In today’s supply chain operations, we speak of value, but focus on functional costs. The focus on functional cost degrades value. Demand error is a poor proxy for value. Reducing costs does not always translate to margin.
To move from a focus on functional cost to value, supply chain leaders need to up the ante. The good news is that the use of new forms of planning platforms (graph, ontological frameworks, and vector DB) and digital representation through technologies like F# allows companies to collaborate and make better decisions using a balanced scorecard. The bad news is that this is in conflict with traditional modeling of single outputs in traditional Advanced Planning Systems (APS) and Enterprise Resource Planning (ERP).
I look forward to your feedback.
Note this work reflects three years of testing. The data sourced from Y charts was charted by Regina Denman and shared with the statistics department at Georgia Tech. The regression analysis is based on nine months of work.
The concepts for the hierarchy were generated through work with Kinaxis and o9 Solutions. The supply chain experts Matt Spooner and Lukasz Zieba contributed significant input in this period.
Definitions
An outside-in planning process requires the organization to develop certain capabilities, such as:
Demand visibility: Understanding the source of demand, how it is translated upstream, and how it is impacted by mix, price, promotional actions, and other demand levers. Demand shaping increases market potential whereas demand shifting moves product from time period to time period without an increase in baseline demand.
Market-driven demand management: Use of market signals to assess baseline or market potential and improve the demand “forecastability”. Item forecastability is determined by the patterns and a Coefficient of Variation (COV) analysis. This is tied to demand sensing capabilities.
Bullwhip eliminator: Translation of downstream market demand into upstream requirements with minimal latency.
The bullwhip effect is the amplification and distortion of demand signals as they travel upstream.
Digital twin: Using a parallel model to enable simulations by planners with minimal latency.
Forecast value added (FVA): Over 90% of companies create forecasts. But many organizations struggle to know whether the demand planning process is driving an actual improvement in the process.
Forecast value added is a measurement of demand planning improvement over the naive forecast (based on shipments of the prior month).
Demand plans go through multiple steps within an organization. The FVA process makes it possible to attribute the change in demand plan performance to a particular action or participant in the forecasting process. FVA determines the effectiveness of any touchpoint in the forecasting process.FVA determines which steps adds value and which do not, to enable the optimization of outcomes. The FVA measurement may be positive (the process is improving the accuracy) or negative (the process is decreasing accuracy).
Data latency: Data latency is the time it takes to translate the signal from the channel to a usable signal for the organization.
Process latency: Process latency is the time that it takes an organization to agree on how to use the signal to drive the decision.
Demand latency: Demand latency is the time it takes for demand to be translated from a channel purchase, to channel replenishment, to an order placed to an upstream trading partner. While most companies believe that an order is a good predictor of demand, the increase in the supply chain’s long tail increases demand latency elongation. With product proliferation, globalization, and micro-segmentation, demand latency dramatically increased over the past decade.