Get More Out of Your Kroger 84.51° and Market6 Data
How Automation and Advanced Metrics You Won’t Get in 84.51° can help you grow your sales at Kroger and avoid inventory headaches.
Kroger collaborates with thousands of food and beverage, health, beauty, and personal care companies to service roughly 2,800 stores. Due to its size, Kroger typically manages its distribution network in-house. If you’re one of these food & beverage companies or play in the general merchandise health and beauty care (GM/HBC) space, Kroger is likely one of your best clients. As such, optimally managing your sales and inventory at Kroger is essential to grow your brand and solidify its foothold with the end consumer. Doing so requires access to a vast set of data to understand your current sales and inventory positions, however.
Luckily, Kroger makes sharing data with its brands a top priority and offers in-depth web portals for analysts, account managers and inventory planners to access.Kroger has a complete analytics arm that is made up of multiple integrated portals. The parent platform is 84.51°, other integrated portals include Market6 and OnDemand. Each system offers sellers access to additional insights. Market6 was bought by 84.51° in 2016 to add improved product movement data capabilities to the platform. These appear as different dashboards and portals to the end user. They are all essential parts of Kroger’s analytics capabilities and, if leveraged correctly, can provide crucial insights to improve business operations.
What you will learn in this guide
What is 84.51° good at?
The vast array of data that Kroger can provide its suppliers is one of the reasons Kroger has won so much market share in the grocery industry. This is especially true in the ‘customer insights and behavior’ realm. Kroger makes it possible for brands to get a true understanding of their customer’s shopping habits and behaviors. It gathers and stores a tremendous amount of data from various sources, including customer transactions, loyalty card data, online interactions, and market trends. Brands can take those insights to improve and personalize the shopping experience through merchandising and loyalty programs. This helps them win repeat business and increase their sales.
Where is 84.51° insufficient?
The 84.51° helps brands better understand their customer. While this is important, the platform doesn’t focus as heavily on streamlining insights to improve the management of sales and inventory. The purchase of Market6 was an effort by 84.51° to fill this gap, and in some ways it did. Brands can now log into the analytics platforms to access live store and DC-level data that they can use to manually extrapolate insights. It’s up to the brand to figure out how to wrangle these vast datasets and determine what to do with their findings. If done correctly, it’s entirely possible to optimize sales, smoothly flow the right amount of inventory through DCs to stores, and tackle problems of seasonality and even phantom inventory. It’s not a simple proposition, however. We’ve broken down five of the top insights we see CPG brands selling into Kroger derive with their 84.51° data.
Five Areas to Focus on Using 84.51° Data
Lost Sales
Lost sales can happen when automated replenishment algorithms fail to align with actual demand, seasonal or event-related spikes aren’t accounted for, product goes out of date, or many other reasons. Measuring the amount of sales that were lost will help you find the biggest culprits affecting your bottom line so you can use your limited time most wisely.
Calculating this metric requires a real-time understanding of your product positions on the shelf as well as a look back into the past at how much you anticipated selling. Check expected demand against out-of-stock products, quantify them in terms of dollar amount, and you’ll get an understanding of where you’re taking your biggest losses.
Days of Supply and Spoilage
Food & beverage companies, and even some personal care and beauty brands, live in fear of excess inventory resulting in spoils. Once expiration dates approach, brands need to act fast to move expiring product as quickly as possible, usually through promotions but also by advising Kroger that inventory in their DCs needs to be quickly pushed to stores. The ‘Warehouse Inventory’ report shows daily inventory on hand by case and case GTIN. In the OnDemand platform, some brands can also access a Supply Chain Scorecard that shows metrics including Days of Supply and Days of Supply Goal. Here you can see the greatest current imbalances in supply and demand are happening in your network. This shows you the current problems so that you can fire-fight in the short term. But to address causes, you need to anticipate the areas where excess inventory will likely lead to spoilages in the future.
Luckily, many brands have access to the inputs they need to calculate this metric, though it’s complex to orchestrate without the aid of software automation. Combine Kroger-provided DC and store-level inventory visibility with scheduled shipments inbound to Kroger, open orders, and forecasted POS sales to identify upcoming areas where supply will outshoot demand. With these calculations, you can take preemptive measures to move product and avoid spoilages before inventory builds up and simple WOS metrics get flagged in OnDemand.
Phantom Inventory
Phantom inventory and inaccurate on-shelf availability are some of the trickiest issues for CPG brands to overcome. Shrinkage resulting from theft is on the rise, and replenishing products that were never zeroed out of the system is a real challenge. Something might also have been damaged, miscounted during inventory counts, or put in the wrong position on the shelf. Whatever the reason, finding and correcting phantom inventory can boost sales and make your entire operation flow more smoothly.
Besides sending a live human to the Kroger store to manually check each SKU, data is your best friend. Many brands don’t know how to properly leverage the data they have to find likely phantom inventory. You can start by viewing the ‘Out-of-Stock Daily’ report in Kroger’s analytics platform. This will show you daily store-level out of stock events. Next, you need to leverage your expected demand forecasts to identify areas where you expect to see sales but aren’t seeing any. Filter by the highest dollar amounts to identify the areas where you’re losing the most money.
Of course, smoothing your POS-based or retailer forecasts into a format that is usable in combination with the report extracted from Kroger’s analytics portals is easier said than done. Brands can attempt to manually calculate these on a one-off basis, or they can rely on an automatic integration between their in-house data and Kroger-provided data to extract and synthesize phantom inventory reports. From there, they know exactly what to direct their Kroger account manager to zero out so the automatic replenishment system resets its ordering pattern. This ends the cycle of insufficient orders and artificially depressed sales.
Insights for Field Reps
Field reps play a huge role in ensuring that all the backend work that happens at home office is being executed correctly in the stores. During a store visit, a rep can validate on-shelf availability, make sure that planograms are being adhered to, ensure end caps are set properly, and pricing is being adhered to. Without equipping them with the right tools, your reps are likely to enter a store blind and not focus their time wisely. Before they get out of their cars, they need to know which products and promotions have been flagged for which specific issues so they know exactly where in the store to check. Information from Kroger’s ‘Store Item Status’ report can be incorporated into field rep reports so they know the accurate store-level item and its location in the planogram. This will help them use their time wisely and ensure optimal relationships between your brand and the store.
By equipping field reps with powerful reports and dashboards that highlight issues by exception, your team can make the most of your field reps’ time.
Measure Promotions
Successful events and promotions are crucial ways you can gain new customers, drive attention to new product offerings, and seize market share away from your competitors. 84.51° does an excellent job helping you understand the motivations and behaviors of your customers so that you can design and implement the best events and promotions, but how do you measure them? Instead of throwing money at the wall and hoping something happens, brands can track and measure their marketing initiatives with the help of data. As the old adage goes, half of your promotional budget is wasted. You need additional tools to understand which half — in real time.
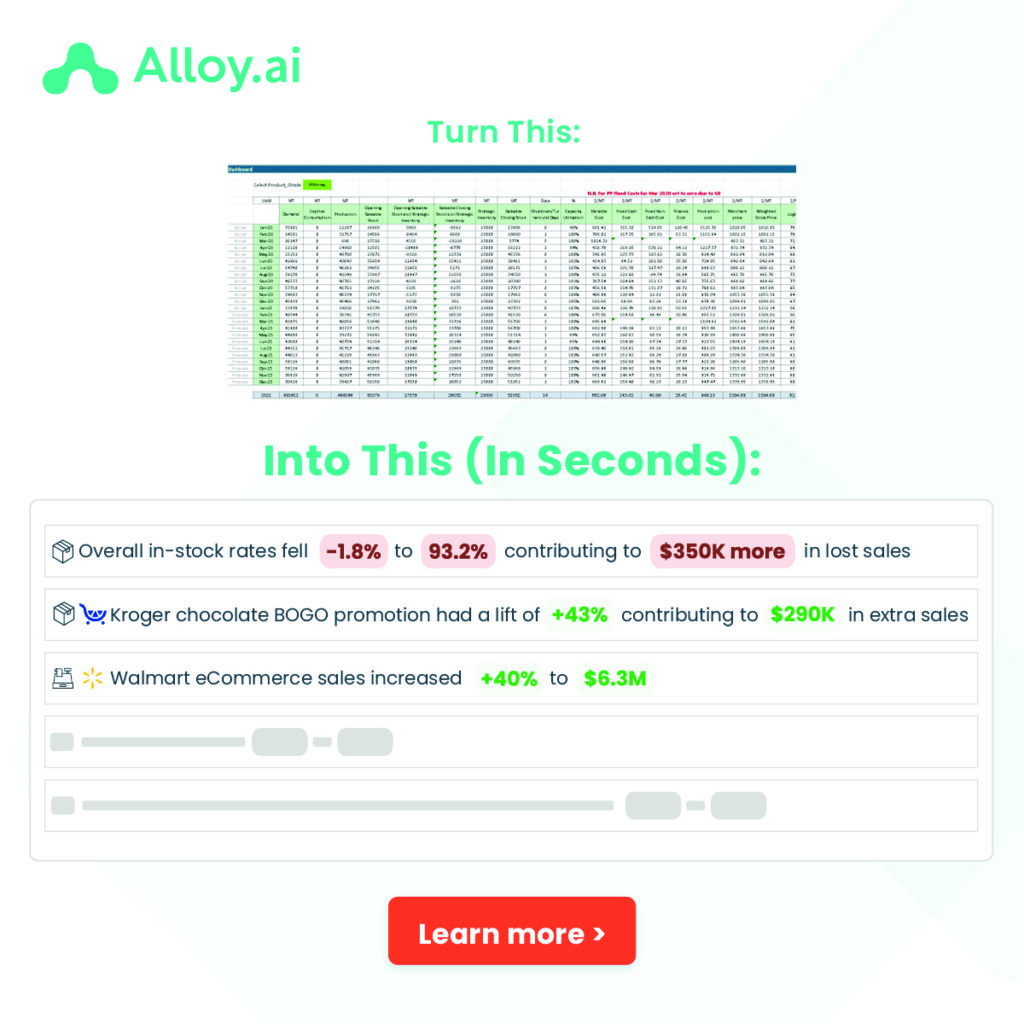
With dashboards like Alloy.ai’s Promotion Performance, sales and marketing teams can see the performance of their promotions in real-time, while it’s in flight. At a glance, a user can see a promotion’s sales lift, as well as how much it will cost their business — and understand ROI.
Another option is to leverage a test-and-learn approach to measure the impact of marketing activities like promotions, geographic-based campaigns, and store displays. Establish a “control” group as well as a “test group.” If you’re launching a new product, for example, a sample of stores that aren’t getting the new product would be your control group while stores receiving the product are the test group. Compare and contrast bumps in sales, any cannibalization of other products, and convert findings into dollar amounts. If you’re seeing record sales but it’s eating into your profit margin, the initiative may not be as successful as you’d like. In this case, you could halt the rollout to additional stores and save potentially thousands of dollars on marketing spend.
Seasonality
For most brands, the busy season is around the winter holidays. There are large meals to prepare, stockings to stuff, and presents to buy. For other brands, their peak season might be the summer months when items like sunscreen or popsicles become popular. Unless you’re playing in an entirely consistent niche, seasonality probably plays an important role in your demand and inventory planning process.
Kroger accounts for historical sales in the retailer forecasts they provide you as a brand. But you can’t solely rely on Kroger to always know what’s best. Help them help you by tracking your seasonal demand to ensure shelves remain stocked and customers remain happy. Doing this requires maintaining a record of historical data. Some people like to export and save CSV files from 84.51° that they can access at a later date. This does require staying consistent and then manually crunching the numbers whenever a specific question is asked.
A cloud-based analytics platform that automatically stores historical data for later use can help. Instead of sifting through old reports, raw data from the past can be easily incorporated into current reports and dashboards as a benchmark. This can help brands better visualize how current seasons are likely to play out and make sure that Kroger is planning their orders optimally so that shelves don’t run empty.
“Alloy.ai has enabled conversations with major global retailers — whether it be Target, Walmart. They now have visibility much sooner than what it shows in their system […] We’re talking to retail partners and saying, ‘Here are the trends that we’re seeing. Here’s what you chase. Here’s what you don’t chase.’ It unlocks a different type of partnership.“
– Dave Henderson, Chief Commercial Officer
What challenges arise if you’re selling through multiple retailers?
Many brands have dedicated, retailer-specific teams to handle their different partners. Most don’t only sell to Kroger, however. If your teams are operating in a silo and never comparing their Kroger metrics to other retailers, they are likely leaving valuable understandings on the table. The ability to compare performance metrics across retailers without manually building reports is transformative, offering insights otherwise unattainable. Brands often discover, for instance, variations in SKU performance between retailers like Kroger and Walmart, prompting critical questions about root causes, demographic influences, and promotional strategies.
Kroger itself also operates multiple retail stores under banners besides ‘Kroger.’ You need to be able to slice and dice your different derived metrics wherever your brand is available. These banners include:
- Supermarkets – Kroger, Ralphs, Dillons, Smith’s, King Soopers, Fry’s, QGC, City Market, Owen’s, Jay C, Pay Less, Baker’s, Gerbes, Harris Teeter, Pick ‘n Save, Metro Market, Mariano’s
- Multi-department stores – Fred Meyer
- Price-impact warehouse stores – Food 4 Less, Foods Co
When you set about to compare multiple retailers, there are data complexities to consider. Advanced analytics tools can automatically smooth differences in naming conventions, like syncing Kroger Line Numbers with Target DPCIs for easier cross-comparison. They can account for different fiscal calendars, unit measurement types, and even currency.
Using a tool to see how your products are performing at Kroger compared with other retailers can help you sell more and grow your brand without the headache of attempting to manually match product attributes.
Why can’t I just use Excel?
Using Excel for analyzing Kroger 84.51° data will work for basic purposes. Brands that want to achieve the best results won’t be able to conduct all their analyses efficiently in Excel, however. Excel lacks the speed and agility you need to deal with large, complex datasets like the ones you can export out of 84.51°. By the time you execute ad hoc requests, it might be too late. Iterating on existing calculations and formulas is also cumbersome and requires an expert analyst. Smoothing data from multiple sources is also a time-consuming process prone to human error, making it a low priority for many teams. This leaves opportunities to optimally understand and manage your sales on the table. Storing and using historical data in Excel is also impractical. Despite being better than nothing for straightforward needs, Excel’s constraints make it an impractical stand-alone solution for brands with access to lots of great Kroger data from their 84.51° portal.
Take Automation and Insights to the Next Level with Alloy.ai
Alloy.ai was built for consumer brands to have full visibility into sales and inventory across every retailer and channel in real-time. Leading consumer brands like Bic, Crayola, Morgan Foods, Spangler and more use Alloy.ai to automatically integrate and normalize sales and inventory data from 850+ retailers, ecommerce and supply chain partners — then quickly surface the insights they need to power their sales.
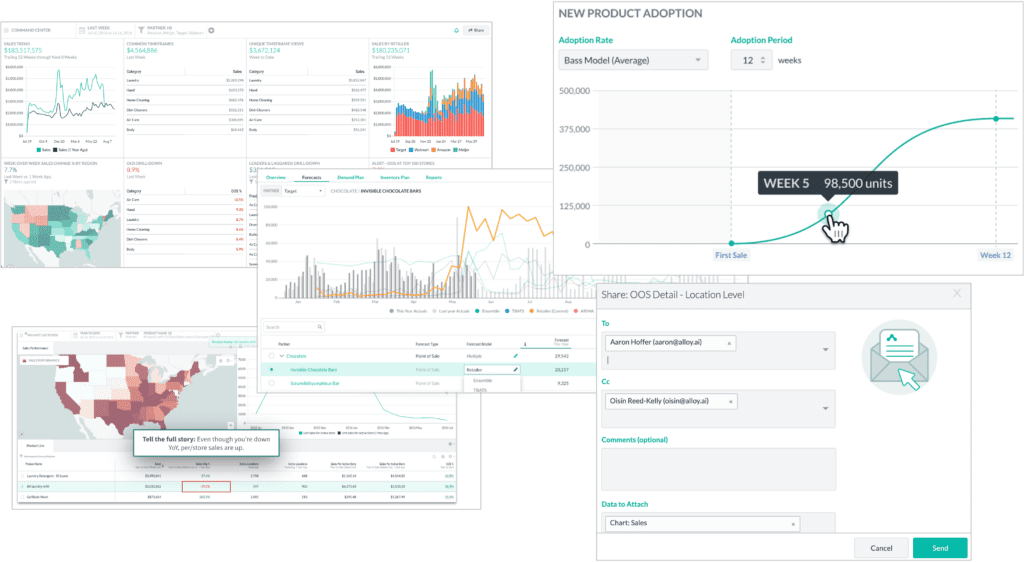
Alloy.ai does more than give you accurate data — it makes it easy to visualize insights with hundreds of pre-built consumer-goods specific metrics and dashboards. And our advanced predictive models alert you of out-of-stocks, phantom inventory, warehouse stockout risks before they impact you.
Brands selling into Kroger can improve their relationship with the retailer by most optimally leveraging the data provided through 84.51° and Market6. After all, Kroger gives their brands access to tremendous data, it’s up to the brand to use it correctly.
Ready to take your Kroger sales to the next level?
“Rather than doing kind of a general, national campaign for marketing, we’re really able to use Alloy.ai data to divert and reallocate spend to really focus on the areas where we don’t have as much sales.“
– VP of Marketing![]()