
Should one use returns data in addition to the sales data as the basis of forecasting
Businesses record the sales to their customers in their ERP to fulfill customer demand. From time to time, these customers might return some of those products. In a sales history file, this might look like a string of positive numbers interspersed by a few negative numbers. These returns can be for various reasons.
- Customer ordered the wrong product.
- Customer order too much
- Customer’s needs have changed
- There was a quality issue
- Etc.
If the negative numbers and the positive numbers are considered together, certain months will look deflated in the total volume.
Question is, should we combine the positive numbers and the negative numbers as we approach the essential business of forecasting future demand? Let us think this through. Suppose, a customer places an order of 1000 units. Then the customer expects 1000 units and hopefully receives as much.
On a later date, the customer deems some of that to be unusable and returns some of that product.
Read More: Do Returns Impact My Forecast Error Calculation Negatively?
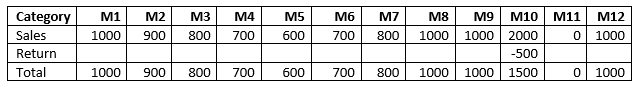
This return most likely happens in a different time bucket. Let us say that the sales in that period were 2000 units and the amount returned was 500. Now if we subtract the return amount from the total sales amount, the net sale amount would be 2000 – 500 = 1500.
The following table shows the data. Columns M1 through M12 represent months 1 through 12.
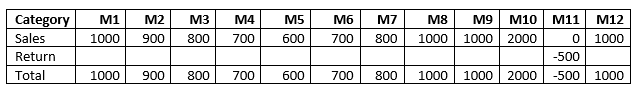
It is also possible that the return shows up a month later in M7. The resulting table would then look like this.
If we use this return adjusted history for the sales forecast, what we will be projecting out in the future will be a smaller than expected amount in terms of what we need to supply to the customer.
This can be illustrated by a simple three-period average forecast. For the total sales, the forecast would be an average of 2000, 0 and 1000 = 1000.
For the case where the return happens in M10, the forecast would be an average of 1500, 0, 1000 = 833.
For the case where the return happens in M11, the forecast would be an average of 2000, -500, 1000 = 833.
A point worth noting: some forecast systems ignore the negative input altogether.
Since we are interested in forecasting the demand to make sure that the product that we have is enough to meet the demand. In that sense deflating the actual sales by the amount of the returns projects a lower number thereby increasing the chances of insufficient inventory or stockouts. This can have business consequences. In most cases, it is not going to be acceptable to give the returned product to some other customer. At the very least, this will take time. In the meanwhile, the other customers are expecting full delivery against their orders. As a result of the lower forecast resulting by including returns in the history, there might be lost sales of the product in question. Any sales of other products that were going to be on the same order (companion sales) could also be impacted. In the worst case, we might lose the customer. The company can lose market reputation and get a bad name.
Read More: 6 Ways You Can Improve Forecast Accuracy with Demand Sensing
In essence, all the problems that are associated with under-forecasting come to the fore.
A better approach is to track the returns separately and not include them as part of the actuals when doing forecasting. If needed, they can be forecasted separately. This will keep the forecast honest and provide the right results for a business.
What do you do in your business? Please tell us.