November 3, 2022
Circularity Ratio is Critical for a Circular Economy
Enterprises need a KPI that transforms supply chains to be more circular in resource consumption and management – the Circularity Ratio is the answer here’s why.
The circularity ratio is the latest KPI that can revolutionize the circular economy. Similar to the power usage effectiveness (PUE) metric, which catalyzed energy efficiency innovations in data centers, the circularity ratio can drive transformative changes in supply chains.
Why is the circularity ratio a high priority? Notably, effective behavior changes require benchmarking to identify improvement areas and progress. For example, tremendous rhetoric complicates initiating sustainability programs and avoiding greenwashing.
A simple, practical, easy-to-implement KPI is needed that promotes moving from linear waste systems to circular supply chains.

Transferring lessons learned to new problems
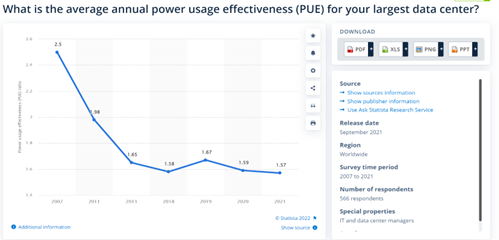
I was part of the data center world when PUE was introduced in 2008, and this metric fostered the efficiency innovations desperately desired by data centers.
PUE is the total power delivered to a data center divided by the power consumed by the servers (CPUs). For example, if 1 watt (W) is delivered to the data center building and infrastructure and 0.75 W is used by the servers (CPUs), then the PUE is 1.3333. Our goal would be 1.0.
Copyright © 2022 by Statista; all rights reserved.
As illustrated in Figure 1, the PUE plummeted from 2.5 in 2007 to 1.65 by 2013. I observed spectacular energy-efficiency improvements due to this new metric.
Previously, too much talk about the data center’s issues never resulted in action. With the PUE KPI, impossible problems became solvable. This same logic applies to the circular economy and global supply chains, and here’s why.
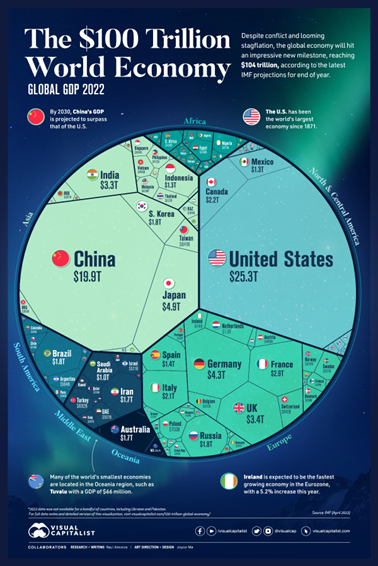
The $100-trillion world economy
Over 100 billion tons of materials annually support the $ 100 trillion world economy (Figure 2). Unfortunately, only 9% of those 100 billion tons are circular (recycling, refurbishing, reusing, etc.) Consequently, 91 billion tons of raw materials are wasted.
Copyright © 2022 by Visual Capitalist; all rights reserved.
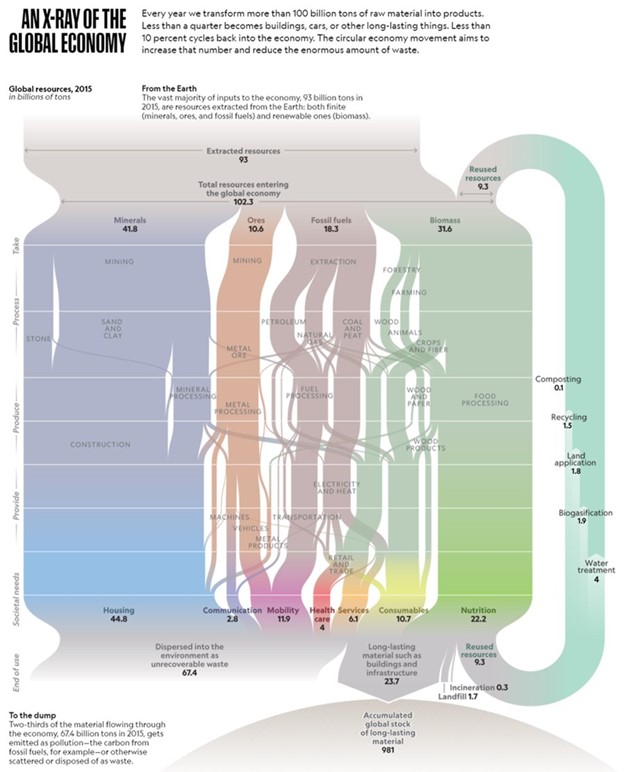
Figure 3 is a phenomenal infographic released by National Geographic. It visualizes how and where 100 billion tons of raw materials are extracted annually to feed the global economy. These are astronomical numbers. Yet, why are 9% of the total raw materials circular?
Copyright © 2022 by National Geographic; all rights reserved.
Over the last 100 years, we, as a species, have become aware of our footprint. In truth, we did not have to think about waste management, as the problem was out of sight and out of mind.
Likewise, we often view plumbing and electricity as out-of-sight and out-of-mind services. However, both utilities are vital for the efficient and safe operation of homes and businesses.
We need a KPI to bring circularity into mind. But more importantly, this KPI must keep people focused on solving circularity in supply chain management. The circularity ratio is that KPI.
What is the Circularity Ratio Formula?
As illustrated below, the circularity ratio formula defines raw material consumption:
Circularity Ratio = Total Assets Purchased / Assets from Circular flow (not virgin material)
From Figure 3, we consume 111.6 billion tons of materials, and only 9.3 billion tons are circular materials. As a result, the current circularity ratio is:
111.6 / 9.3 = 12
If the goal is 1.0 for raw material circularity, then the global economy has a long path ahead. To drive energy improvements, data centers published PUEs to demonstrate their efficiencies and counter negative propaganda about waste. More appreciably, an efficient PUE score became a badge of honor at the data center.
Once companies marketed their PUE achievements, competition drove more efficiency gains. Likewise, solving supply chain problems needs the same mindset and support.
A circulatory ratio of 1.0 is only possible when the total assets purchased are all non-virgin material assets (i.e., materials sourced from circular flow).
What roadblocks hinder achieving improved circularity ratios?
Three problems block attaining a circularity ratio of 1.0 and are:
- Supply and demand issues are still present in procurement processes. Companies need help to procure enough circular materials. Too often, they don’t know where to find it. Unfortunately, there is no central location to store all known assets.
- Scientific breakthroughs that could bring more raw materials into the circular economy are still developing.
- Status quo conduct hinders progress. But unfortunately, the current mindset is to keep doing the same behaviors because they are established methods.
The circularity ratio KPI can solve these problems. In summary, I believe that the circularity ratio will achieve three things:
- Companies and people must start investigating more efficient supply chain solutions such as asset management software to bring their circularity ratio to the ideal score of 1.0.
- Over the long term, spur-technology breakthroughs will bring more complicated materials into the circular economy.
- Changing the status quo will create an environment where a lower circularity ratio is purposeful, sustainable, and profitable.
We can use the lessons from the data centers’ PUE example and apply them to the circularity ratio.
Result: All of the circular economy problems will disappear.
Please schedule your demo today for more information on how we can assist with your Circularity efforts.