
I’ll start with a confession: I’m an algorithm guy. My heart lives in the “engine room” of our software, where lightning-fast calculations zip back and forth across the AWS cloud, generating demand and supply scenarios used to guide important decisions about demand forecasting and inventory management.
But I recognize that the target of all that beautiful, furious calculation is the brain of the boss, the person responsible for making sure that customer demand is satisfied in the most efficient and profitable way. So, this blog is about Smart Operational Analytics (SOA), which creates reports for management. Or, as they are called in the military, sit-reps.
All the calculations guided by the planners using our software ultimately get distilled into the SOA reports for management. The reports focus on five areas: inventory analysis, inventory performance, inventory trending, supplier performance, and demand anomalies.
Inventory Analysis
These reports keep tabs on current inventory levels and identify areas that need improvement. The focus is on current inventory counts and their status (on hand, in transit, in quarantine), inventory turns, and excesses vs shortages.
Inventory Performance
These reports track Key Performance Indicators (KPIs) such as Fill Rates, Service Levels, and inventory Costs. The analytic calculations elsewhere in the software guide you toward achieving your KPI targets by calculating Key Performance Predictions (KPPs) based on recommended settings for, e.g., reorder points and order quantities. But sometimes surprises occur, or operating policies are not executed as recommended, so there will always be some slippage between KPPs and KPIs.
Inventory Trending
Knowing where things stand today is important, but seeing where things are trending is also valuable. These reports reveal trends in item demand, stockout events, average days on hand, average time to ship, and more.
Supplier Performance
Your company cannot perform at its best if your suppliers are dragging you down. These reports monitor supplier performance in terms of the accuracy and promptness of filling replenishment orders. Where you have multiple suppliers for the same item, they let you compare them.
Demand Anomalies
Your entire inventory system is demand driven, and all inventory control parameters are computed after modeling item demand. So if something odd is happening on the demand side, you must be vigilant and prepare to recalculate things like mins and maxes for items that are starting to act in odd ways.
Summary
The end point for all the massive calculations in our software is the dashboard showing management what’s going on, what’s next, and where to focus attention. Smart Inventory Analytics is the part of our software ecosystem aimed at your company’s C-Suite.
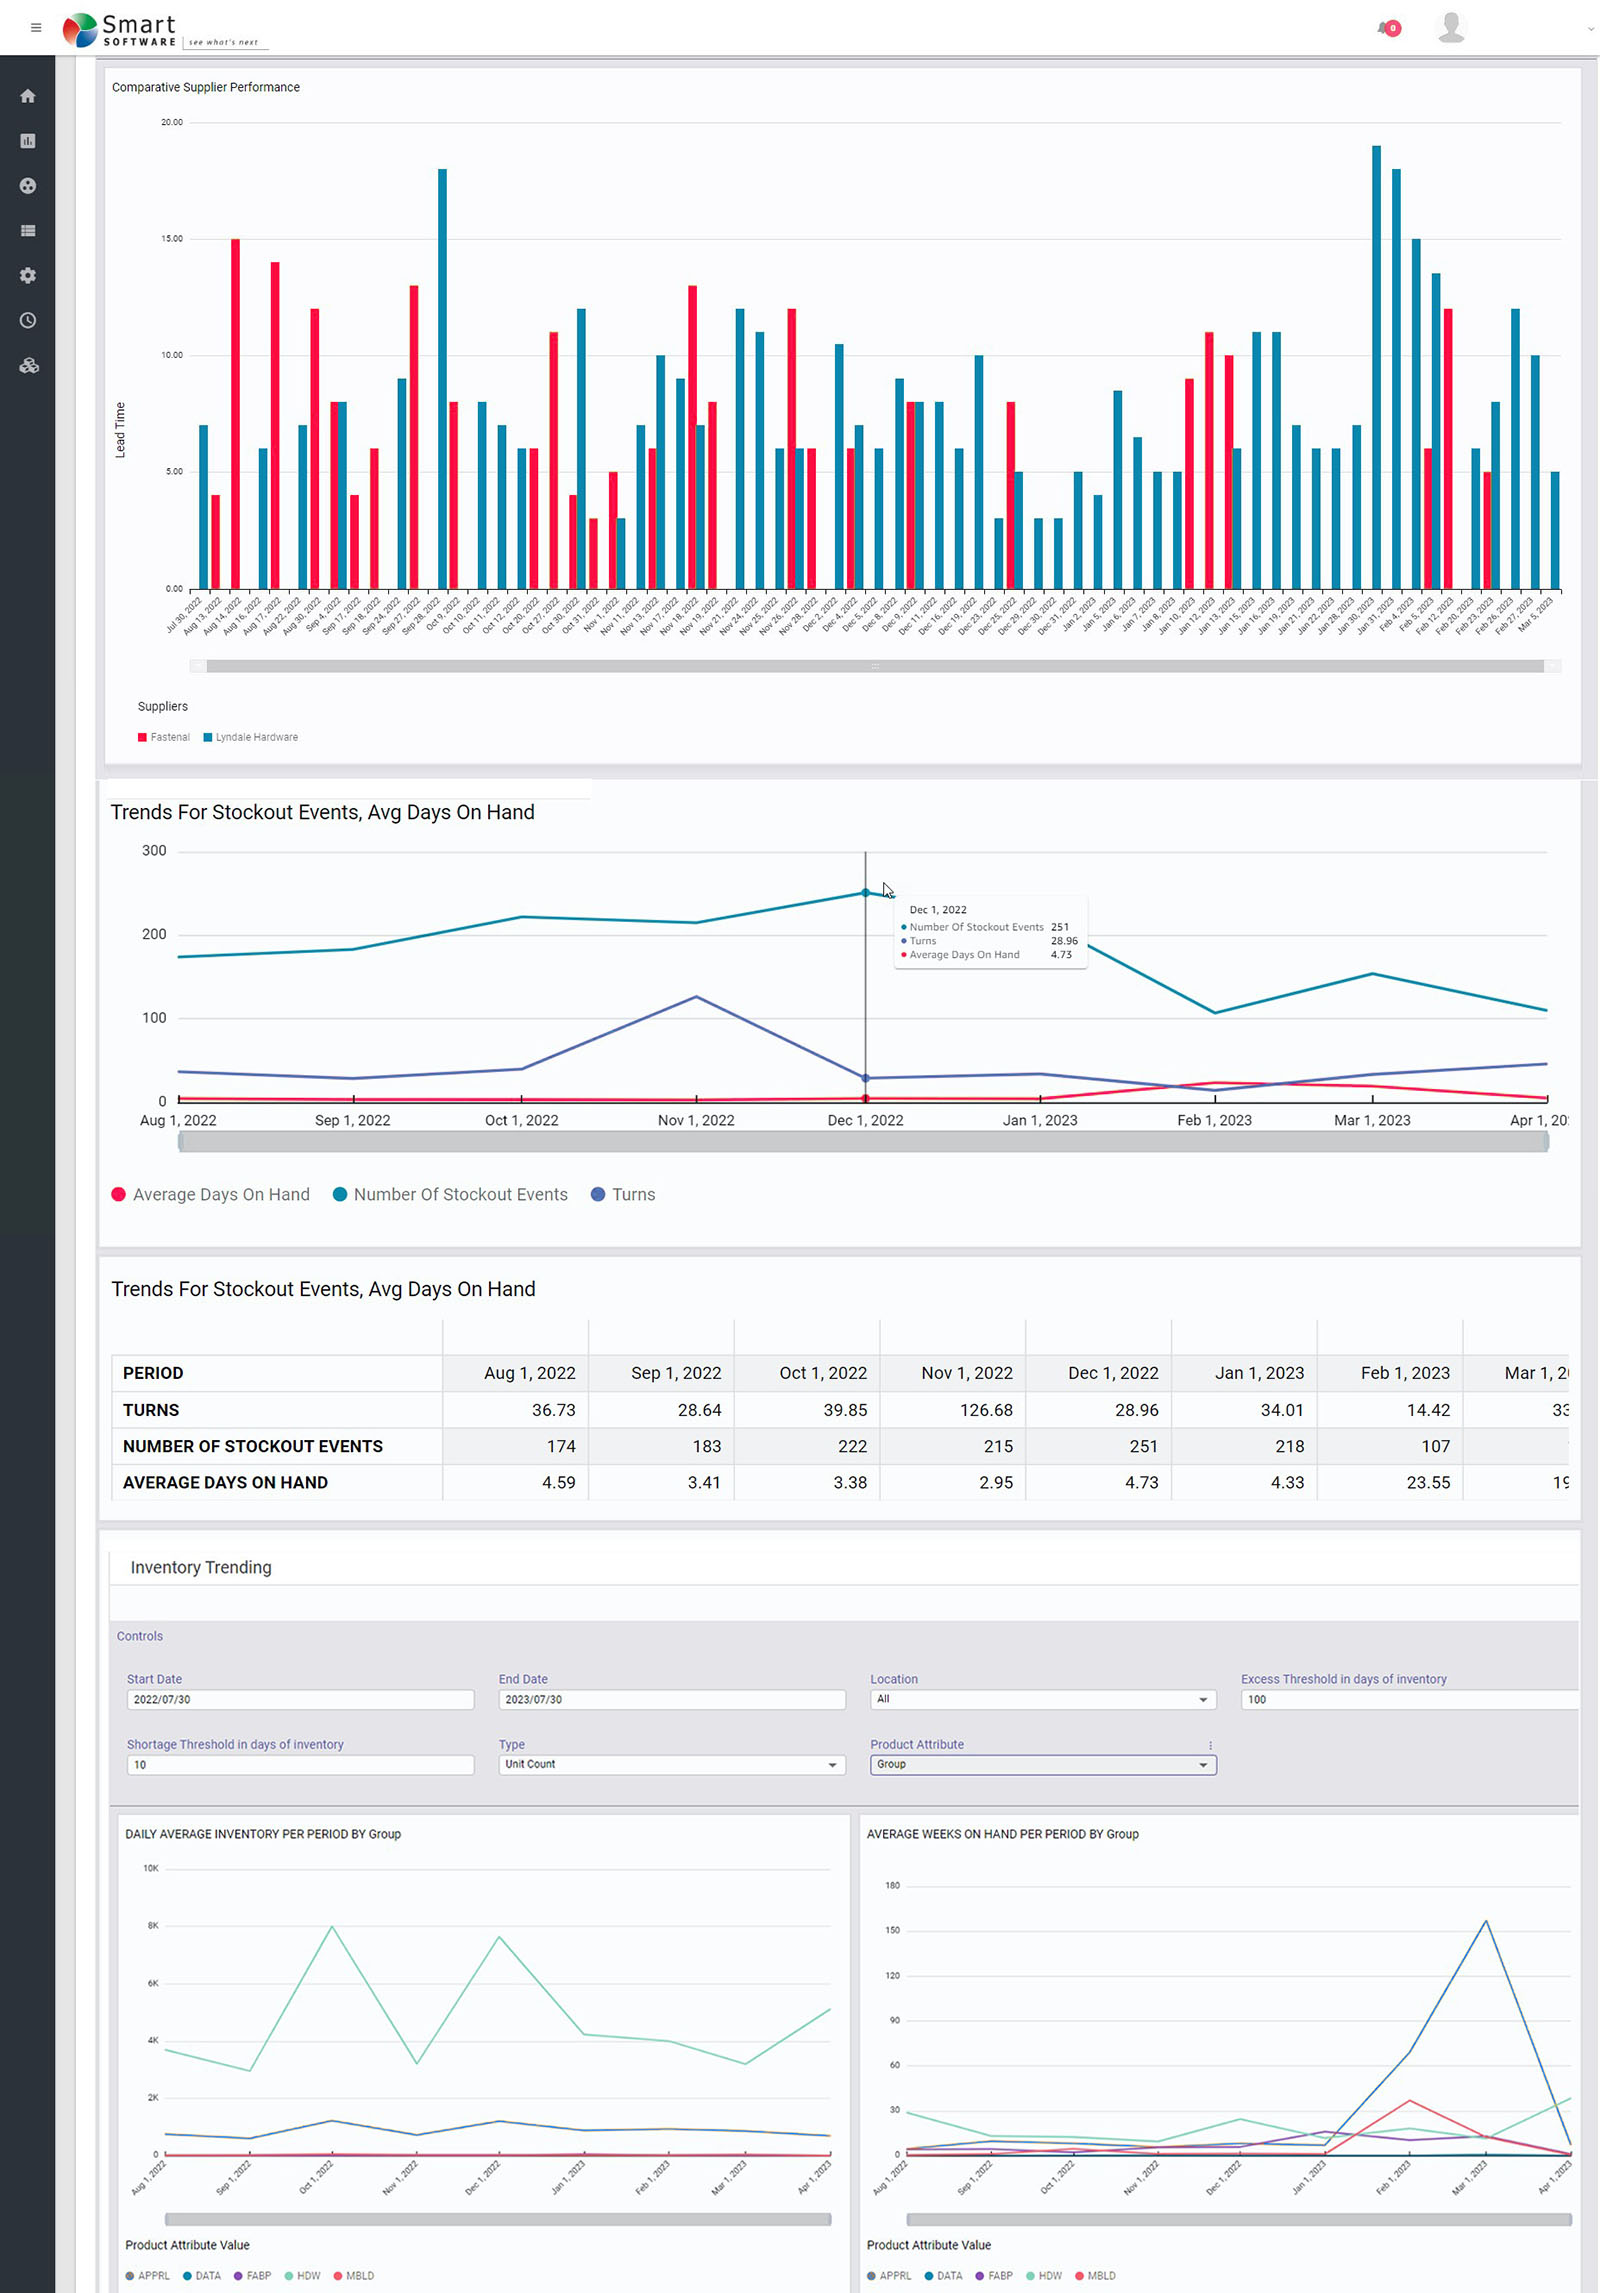
Figure 1: Some sample reports in graphical form