The market literature, currently dripping with Artificial Intelligence, primarily focuses on discussions to build better engines to drive insights. This leads me to the question, “If the car’s frame is broken, can a better engine help?” I don’t think so.
The basic frame of supply chain planning–functional taxonomies for optimization on a relational database–must be redesigned before supply chain leaders can reap the benefit of deep learning, neural networks, and evolving forms of Artificial Intelligence (AI).
My Perspective and Point of View
Traditional supply chain technologies depend on relational database structures. In these conventional IT approaches, data is written and coded with fixed semantics into rows and columns. I term this our data jail.
Primed for transactional efficiency, these legacy architectures based on relational databases drive order-to-cash and procure-to-pay efficiencies. Still, they are ineffective in analyzing flow, understanding relationship patterns, using disparate data, or driving multi-tier insights. As the world becomes more complex–dependent on multiple tiers of suppliers and outsourcing relationships–legacy approaches using relational database architecture are insufficient. Using NoSQL and rethinking supply chain planning architectures is a prerequisite to using new forms of engines available through AI.
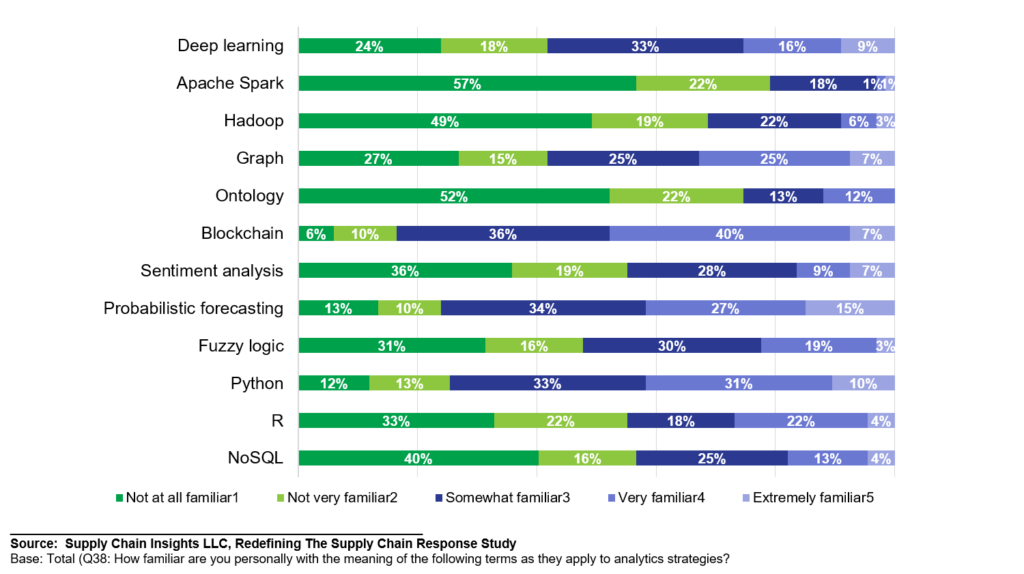
In a recent study, roughly 1/3 of respondents were familiar or very familiar with the concepts of the Graph Approach. Most current spending is focused on deploying traditional optimization on relational databases. (The focus of the Gartner Magic Quadrant.)
Figure 1. Current Familiarity with Analytic Concepts (Fall 2022 Snapshot)
Preamble
Supply chain leaders love their rows and columns. Like Linus clinging to his blanket, supply chain teams make most of their decisions on Excel spreadsheets.
Relational database structures are a barrier to modeling relationships and flow. Isn’t it ironic that a relational database is poor for mining data about multi-tier relationships? Or there is no true relationship management in the structured data models in Supplier Relationship Management (SRM) or Customer Relationship Management (CRM). Or a unified data model across source, make, and deliver for planning? (TMS and DRP have little in common, and revenue management operates isolated from demand planning.)
In contrast, a graph database is a non-linear data structure based on vertices and edges. The vertices are also termed nodes; the edges are lines or arcs connecting any two nodes in the graph. More formally, a Graph is composed of a set of vertices( V ) and a set of edges( E ). The graph is denoted by G(E, V).
The graph relates stored data to understand and analyze the shifts at the nodes and edges. The graph relationship structure enables stored data to be linked together directly and, in many cases, retrieved with one operation. Graph databases hold the relationships between data as a priority. As a result, data query is fast. A graph is a form of NoSQL: the meaning is that SQL cannot be used as a query language. Graph architectures also use different optimization technologies.
Semantics
The movement to flow and relationship sensing also requires a greater focus on semantics. Why are semantics important? Let’s start with a basic definition. Semantics are data characteristics to enable usage across multiple roles and use cases. Semantic reconciliation gives data meaning. Translation of the schema and semantics of data sets enables data translation and improves usage. Examples are product attributes, units of measure, selling units, and regional channel characteristics. The list can go on and on…
While the concepts of data semantics are highly abstract on many levels, there is a simple goal. Semantic reconciliation allows multiple parties to interact with data based on an embedded set of clear, well-defined rules everyone can understand and follow. Creating data semantics is analogous to mapping grammar and style rules in content writing style guides (Think Chicago Style Guide 10). Similarly, the Dewey Decimal system in the library is a manual semantic reconciliation system. Semantics and schemas go hand-in-hand to enable effective discovery. Ontologies help to translate semantics. An ontology is a graph database use case.
The So What And Who Cares?
So what does this all matter? What is the business case?
- Market-Knowledge Graph. Demand latency (the time from purchase by the customer to order visibility by the manufacturer) is weeks and months. Building a market knowledge graph enables the modeling of market insights and trends, the building of product profiles, and the visualization of demand shaping and shifting. Today, there is no good way to connect the flows of demand data from customers, across Vendor Managed Inventory programs (VMI), through sales account teams, over marketing programs, and sales execution processes to drive a demand visibility signal of flow to be used by the role. o9 and OMP are currently testing the building of outside-in processes to visualize demand flow and drive insights. Most companies are not aware of demand latency in their day-to-day discussions, nor do they have the ability to visualize and manage demand flow assumptions across roles based on market data.
- A Quicker and Better Signal for the Customer. A unified NoSQL data model reduces the latency to drive data across nodes and trading partners. Why is this needed? The role of batch interfaces takes time. If a company wants a perpetual inventory signal that is current and representative of the network, the unified data model allows roll-up in minutes, not hours. This enables a quick response for Available-to-Promise (ATP) and Allocation based on shortages. Dealing with shortages and improving customer response is top of mind in most organizations.
- Trading Partner Graph. The deployment of graph technology to trading relationships enables insights on flows to aid in decision-making in supplier development, supplier reliability, and ESP/CSR goals. I am excited to see this form of deployment in Everstream Analytics and Transvoyant’s current work. The traditional Electronic Data Interchange (EDI) approach enables transaction exchange but does not enable the visualization of flow or the sensing of trading partner reliability.
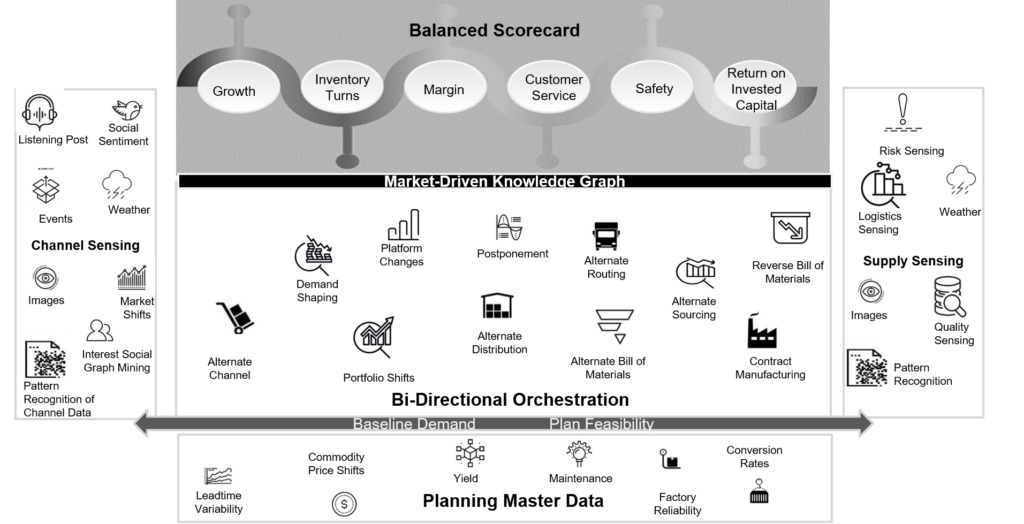
- Bi-directional Orchestration. Practical semantic reconciliation enables the movement from data integration to interoperability enabling bi-directional flow optimization. Why is this needed? The greatest value in the network is making effective trade-offs between source, make, and deliver. Today’s engines (optimization, AI, and pattern recognition) are embedded in traditional taxonomies within functional processes. (Today, these trade-offs only happen on an ad-hoc basis through the deployment of network design technologies like AIMMS, Coupa, OMP, Optilogic, and RiverLogic, and the focus is on asset utilization, not flow or bi-directional trade-offs.) The testing of bi-directional orchestration using a graph is currently being tested at a couple of manufacturing locations. Stay tuned.
Figure 2. Depiction of Bi-Directional Orchestration to Align the Supply Chain Across Make, Source and Deliver Align to a Balanced Scorecard
NoSQL is not a panacea. The optimization engines are different, and the approach is inconsistent with current integration back office processes. Visualization technologies are evolving. Think of the use of the graph as you learn about AI and evolve your processes to visualize flow, manage the reliability of relationships, and improve enterprise sensing. I hope this helps. I look forward to hearing from you.