Your Ultimate Guide to Walmart Luminate
What is Walmart Luminate? Why Does it Matter? How Can You Maximize its Value?
What you will learn in this article
What is Walmart Luminate?
An Introduction to Walmart Luminate
Walmart Luminate is the retailer’s new data, analytics and reporting tool for suppliers — and it represents a massive step forward in retailer-supplier collaboration. The purpose, according to Walmart, is to offer “ a unified view of retail insights, making it easier for suppliers of all sizes and merchants to grow their businesses.”
This guide is the first to explore this new platform in detail. We will explore:
- The unique benefits of Walmart Luminate and how it compares to Retail Link
- What this new platform can do for your business
How to get started on Walmart Luminate - How to ensure you get the most out of your Walmart Luminate investment
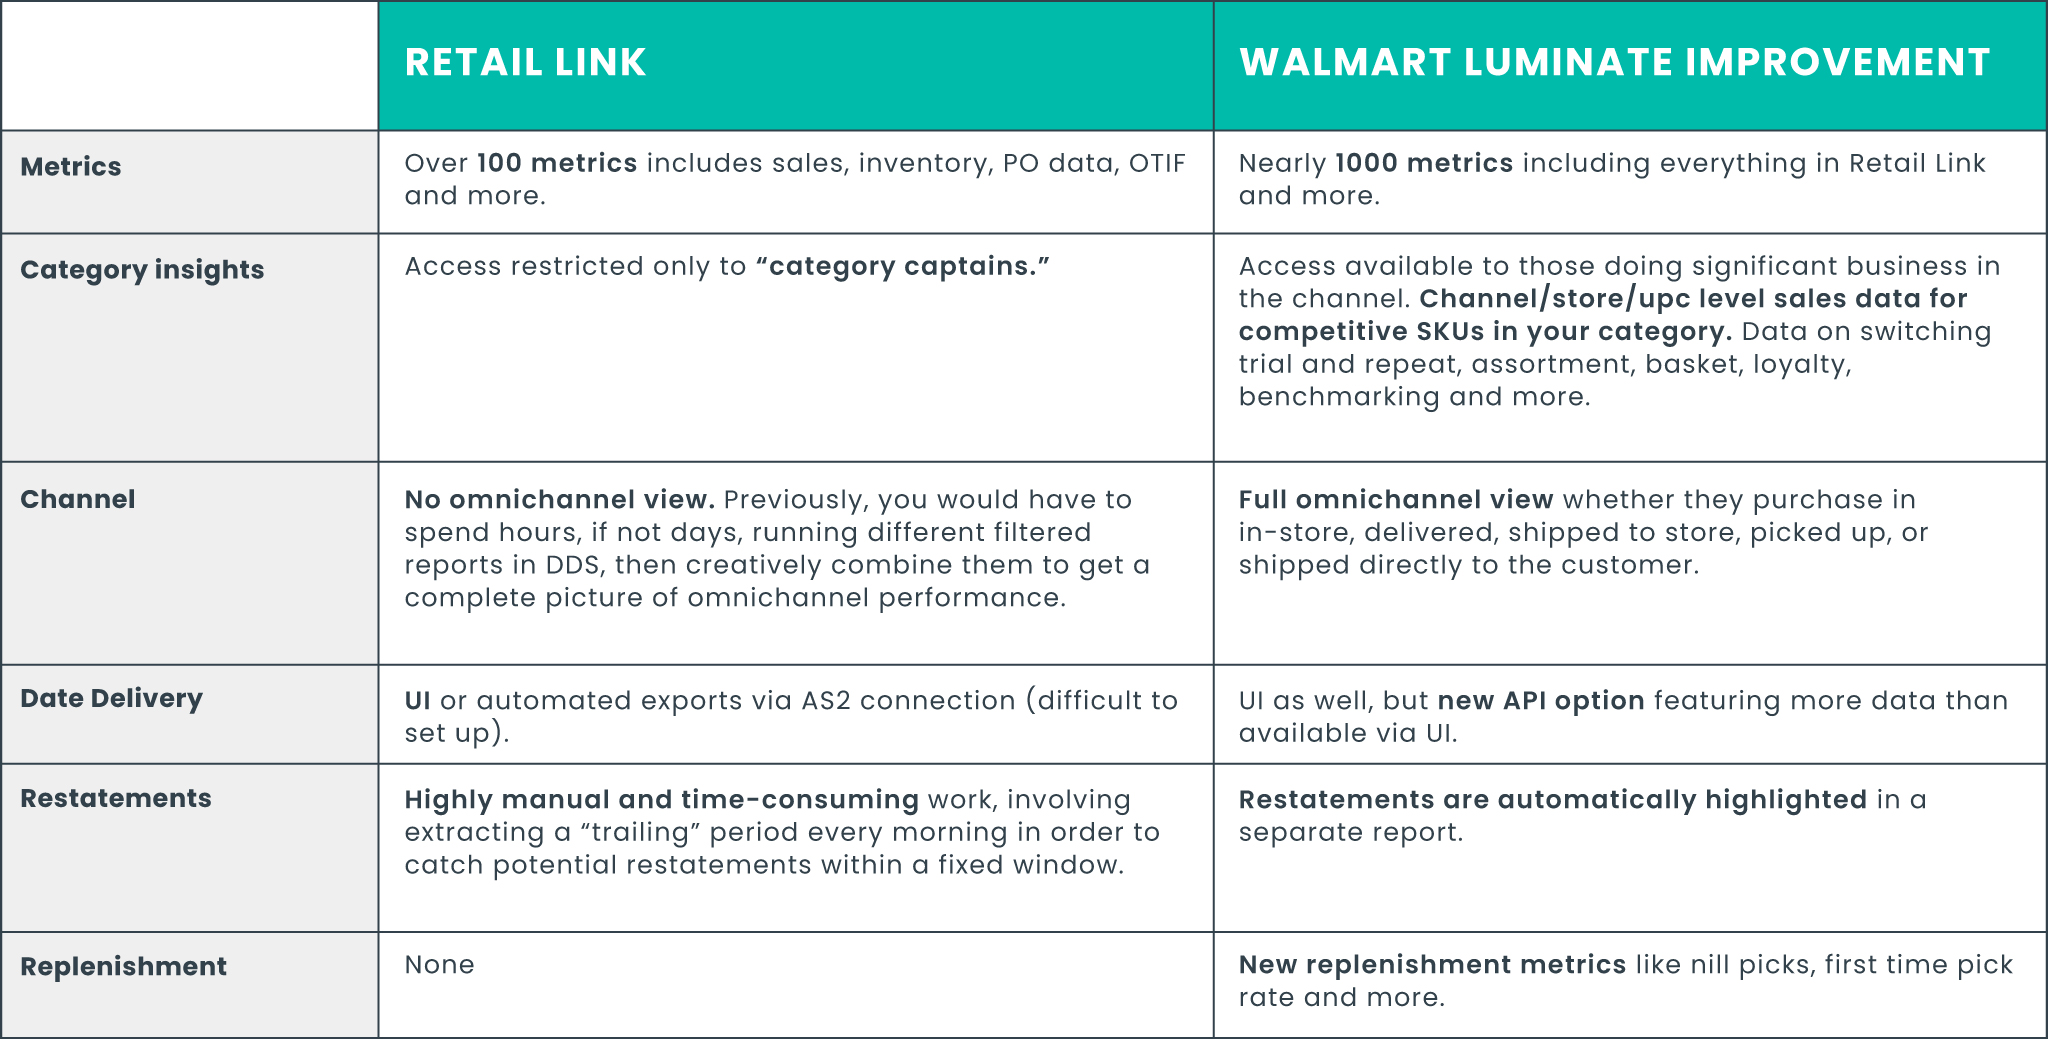
When Retail Link was first released decades ago, it represented the latest in technology. But over the years its limitations have become more obvious: the UI is cumbersome and querying data is time consuming and manual. Expert practitioners have spent years learning work-arounds to get the data they need to run their business.
The good news is that Walmart is finally uplevelling the data capabilities they’re sharing with brands — with both a new UI and new backend API capabilities to help brands identify problems and opportunities at the shelf, and take action.
“Walmart Luminate represents a massive step forward in retailer-supplier collaboration.”
– Joel Beal, CEO and Cofounder @Alloy.ai
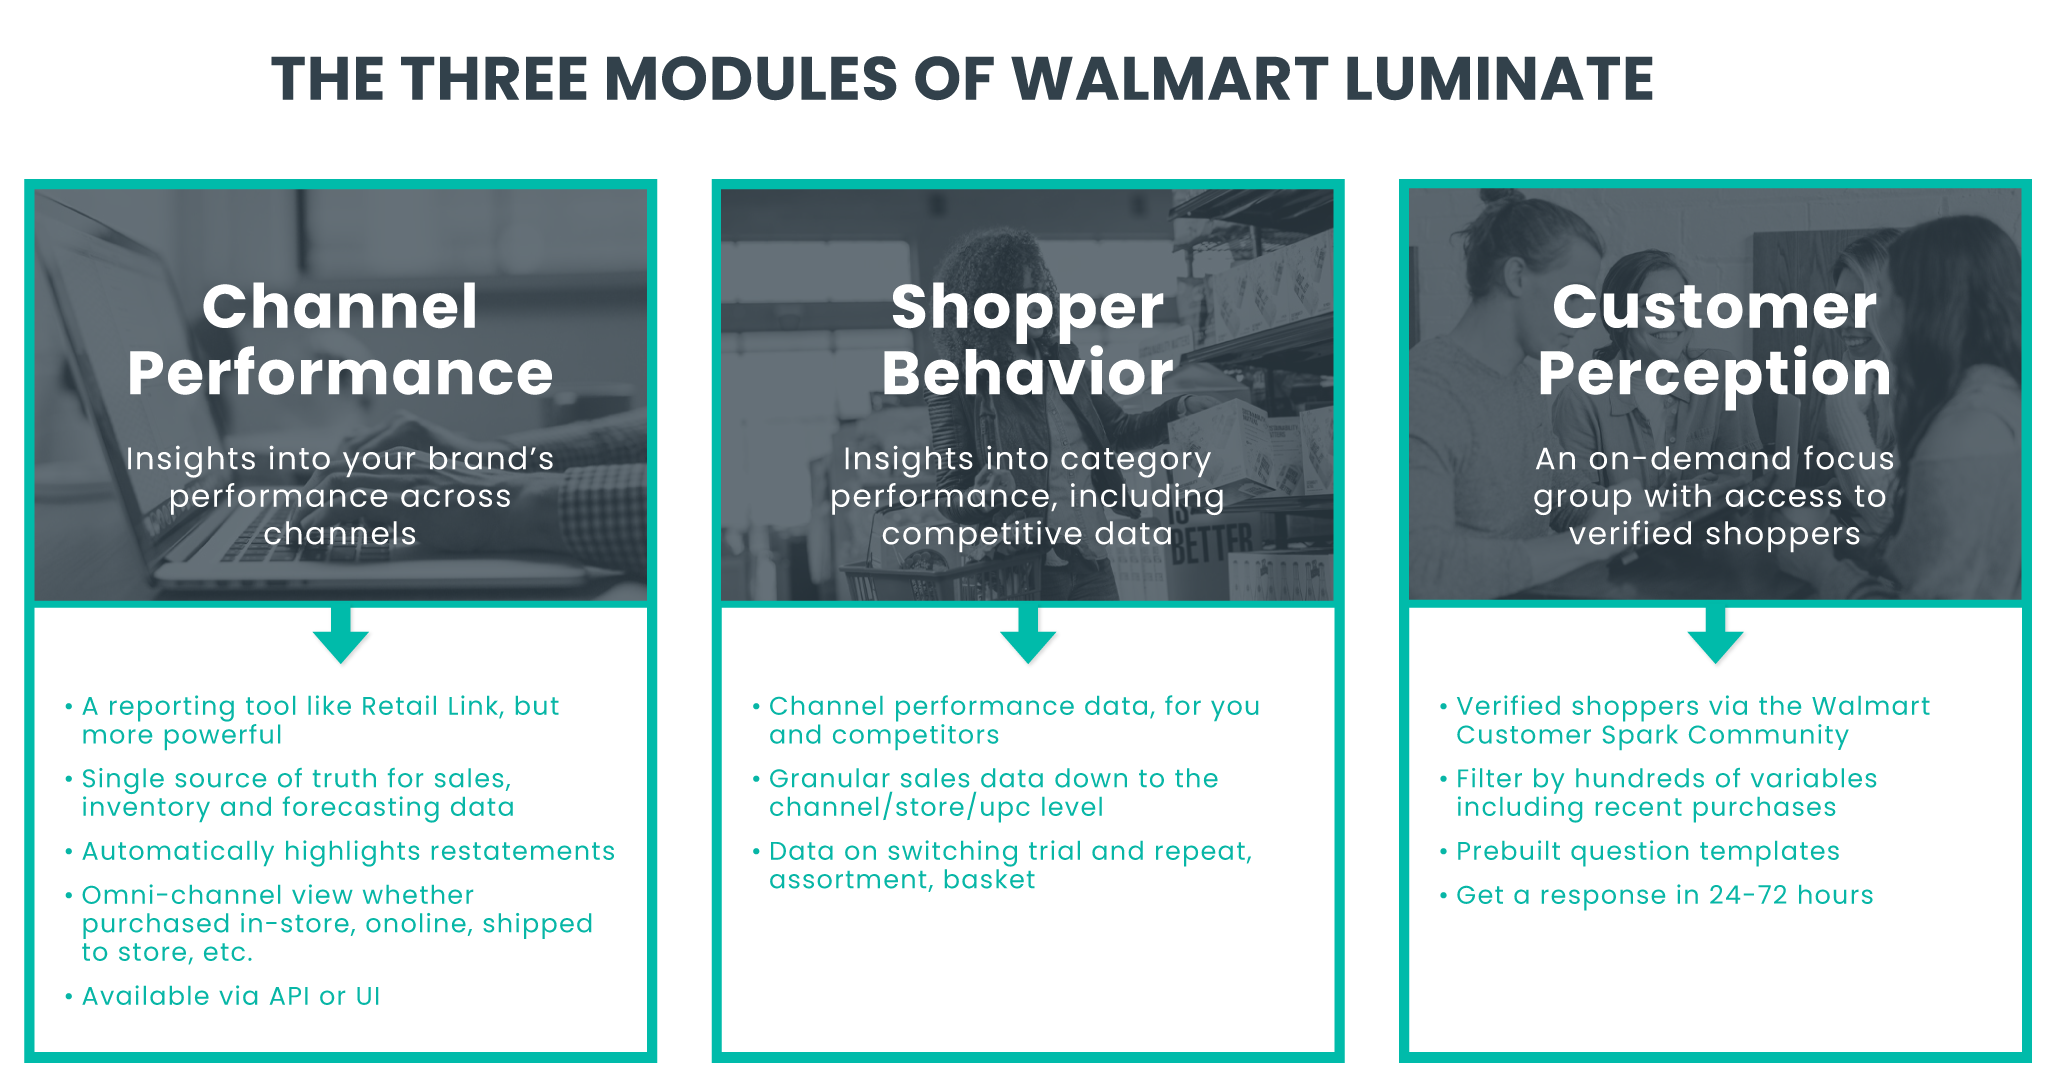
Walmart Luminate is divided into three different “modules”:
- Channel Performance – A tool to measure your sales performance
- Shopper Behavior – Category-level data that gives you a glimpse into competitors performance
- Customer Perception – A sort of on-demand focus group of shoppers to give you feedback
Channel Performance
This part of the platform will have insights into your brand’s performance across channels. Retail Link veterans will rejoice, as this is basically an enhanced Decision Support System (DSS) with all its functionality plus more. Channel Performance in Walmart Luminate is intended to act as your single-source of truth for sales, inventory and forecast data. Unlike Retail Link which pulls from data that may not be what Walmart is working from, this is the exact same data that Walmart’s own team works from — so it’s guaranteed that you and your buyer will be working from the same source of truth.
Commerce has changed since Retail Link was released, one of the major changes being omnichannel fulfillment. Channel Performance in Walmart Luminate gives you a true omni-channel view of sales, whether the purchase is in-store, delivered, shipped to store, picked up, or shipped directly to the customer.
Some highlighted improvements over Retail Link include:
- An omni-channel sales view facilitating how you can track both brick-and-mortar and e-commerce performance in one place
- Improved OTIF (one time in full) visibility with more transaction-level detail and analytics
Inventory optimization where you can even request store-level inventory in “near real time” - Better replenishment metrics such as nill picks which could indicate problems like phantom inventory
- API availability to run queries for bulk data export including ongoing live feeds, historical mode and restatements to improve data accuracy
If you’re a Retail Link power user you can probably get some of this information from Retail Link today, but it’s extremely difficult and manual to get the data around channels, for example, to align. With Walmart Luminate this is a non-issue.
Another headache that Walmart has addressed with Luminate is restatements. Restatements are corrections that Walmart issues when dealing with incorrect or incomplete data. Restatements are extremely common. In fact if you’re not taking restatements into account you’re probably working from inaccurate data. Today, Walmart doesn’t call out restatements, so you have to pull historical data and manually account for restatements by looking at the difference between data sets. Luminate highlights these restatements as soon as the data is available.
Another improvement Walmart Luminate offers over Retail Link, comes in the form of data delivery. While Retail Link requires you to login to the portal to pull data, Walmart Luminate offers two options:
- UI Based – A self-serve report builder where customers can login to find insights and analytics
- API-Based – Get a direct data feed in near real-time
The API offering is a recognition by Walmart that their users want more control over their data, since it allows users to bring that data into more analytics, planning and data warehouse solutions. For companies that are set up to take advantage of this, the API-driven approach is the superior choice. Not only do you get more control, you also get more data to inform your execution decisions. If you access your data via the UI you can see a rolling two years worth of data. But when you sign up via the API you get that same two years of data, plus everything since you’ve signed up.
Data for Channel Performance is updated and available daily just like it is with Retail Link. Those using the API will probably notice one improvement — their data will now be available earlier in the day, instead of having to wait for scheduled export jobs from Retail Link.
Shopper Behavior
Walmart Luminate’s Shopper Behavior module is an entirely new offering — one that offers insight into category behavior, not just for your brand but for competitors in your category, too.
You will be able to access channel/store/upc level sales data for all SKUs in any category in which you do a meaningful amount of business. This module also includes data on: switching, trial and repeat, assortment, basket, loyalty, benchmarking and more.
In shopper behavior, you will be able to see category sales data including:
- Omni UPC Number
Channel - Region
- Sales amount
- Sales quantity
- Basket transaction counts
Note that some Shopper Behavior data will be available via API as well. Data available in this module will be crunched at the weekly level. You will be able to see down to the daily level (switching, basket reports, etc), but this data will only be refreshed once per week.
Customer Perception
Customer Perception is another new module in Walmart Luminate that the retailer promises can help you understand “the why behind the buy.” It may be best thought of as a hyper-targeted focus group, available on demand. You can tap into a panel of verified shoppers via the Walmart Customer Spark Community for direct feedback. Brands can use this module to test new product ideas, marketing campaigns, vet potential price increases and lots more.
Customer Perception makes the market research process easier and more effective in a few key ways:
- Verified buyers – You can target your buyer using hundreds of different variables, all the way down to the UPC level of recent purchases
- Eliminating self-reporting – Transactions are verified and updated daily, so you don’t need to rely on self-reported purchasing behavior
- Question templates – Walmart Luminate comes equipped with a library of survey templates and questions
The average survey completion time is 24 to 72 hours.
Why Luminate?
Walmart Luminate offers both a richer data set and it’s also more flexible in how it allows you to collect and use that data. The improvements over Retail Link make it much easier to find the insights you need to run your business. And the range of new metrics — such as category level insights in Shopper Behavior — give you considerable visibility into your brand’s performance against competitors. Because you can’t improve what you can’t see, this category visibility offers a competitive advantage for companies who properly leverage it.
Walmart Luminate Supercharges Your Decisions With More Metrics
- Category sales
- Improved OTIF performance
- Omnichannel inventory
- Replenishment metrics like first time pick rate and nill picks
- DC level “cuts” or product that a DC was not able to fill when sores ordered
Omnichannel Visibility
Previously you would have to spend hours if not days running different filtered reports in DDS, then creatively combine them to get a complete picture of omnichannel performance. Not anymore. Now you can get a full view of your sales whether the purchase was delivered, in-store, shipped to store, picked up, or shipped directly to the customer.
Leverage the API for Greater Speed and Accuracy
Say goodbye to a 2 hour coffee break while Retail Link runs a report in the morning. By using the API you get faster data extraction every morning to keep a pulse on what happened yesterday.
With the API you also get enhanced historical data availability including more metrics and higher query limits to feed your data lake with historical performance, and improved data accuracy with restatement flags (for a trailing 2 year window).
How to Get Started with Walmart Luminate
1. Get Access to the Portal
Contact your Walmart Account team to ask for access to Walmart Lumiate. They will be the right point of contact to initiate the process of creating your consumer IDs to get access to the UI and API websites. They will also be the correct team to provide you a quote for how much it will cost you to get access to Luminate.
Soon after that, they will involve the Walmart Luminate team, who will need to collaborate with your IT team to exchange public API keys and specify your preferred format for exporting from the API.
2. Begin Extracting Data from the Portal
Once on-boarded into Luminate, you will have 3 ways to pull data:
- Continue manually pulling data – Similar to Retail Link, Walmart Luminate has a UI to build queries and pull reports
- Rebuild your integrations – If you had previously automated the work of pulling Retail Link’s raw data into your data lake, you will now need to rebuild these integrations with the new API
- Automate the pulling and harmonizing of data – Use a platform like Alloy.ai, which automatically pulls and harmonizes the most recent data from Walmart Luminate (and other systems) — giving you turnkey access to all of your Walmart Luminate data
3. Start Finding Insights
Once you can successfully extract data, you will be able to use your preferred analytics tool to find insights in this myriad new data, and begin coordinating with your Walmart contacts to take action and improve your brand’s performance.
The Value of Automating Your Walmart Luminate Data
Walmart Luminate is a powerful tool, but it’s also a costly investment. Maximize this investment by letting Alloy.ai simplify the work of getting started with Walmart Luminate, extracting and managing the data, and finding insights. Walmart is providing an unprecedented amount of new data. Alloy.ai is a data aggregating, sales intelligence and predictive alerting tool that helps you make the most of your Walmart Luminate investment.
Less Time Managing Your Data, More Time Managing Your Business
Alloy.ai automatically connects to Walmart Luminate and hundreds of other retailers, then harmonizes the data in real-time, to ensure you’re always working from the most accurate data set. With these pre-built integrations and hundreds of consumer-goods specific dashboards and metrics, you’ll be up and running with Walmart Luminate in days instead of months.
If you’re planning on using the API, there’s no need to wait on your IT team to build or rebuild your integration.
Alternatively, if you are currently analyzing your Retail Link data by pulling it manually and then analyzing in Excel or a BI tool, Alloy.ai can give you back hours of your work week. Forget having to log in, run a report manually and wait thirty minutes to an hour to have your data ready to analyze. Automate that part of it, so that the freshest data is always available when you walk in at 8 AM.
Get the Right Visualizations with the Latest Data
The major drawback of creating data visualizations in Excel is their static nature. They require manual updates, and in today’s fast-paced business environment, they often become obsolete by the time they circulate throughout your organization. Consequently, Sales leaders, Supply Chain leaders, and Executives may find themselves making crucial decisions based on outdated data.
Alloy.ai’s data platform, on the other hand, automatically retrieves data from every retailer portal. This gives you real-time visibility into your demand and inventory status, from store shelves to warehouses. Additionally, it offers predictive simulations to anticipate future developments. This real-time insight is essential for brands to respond promptly to changing conditions and make informed decisions to reduce stockouts and minimize excess inventory costs.
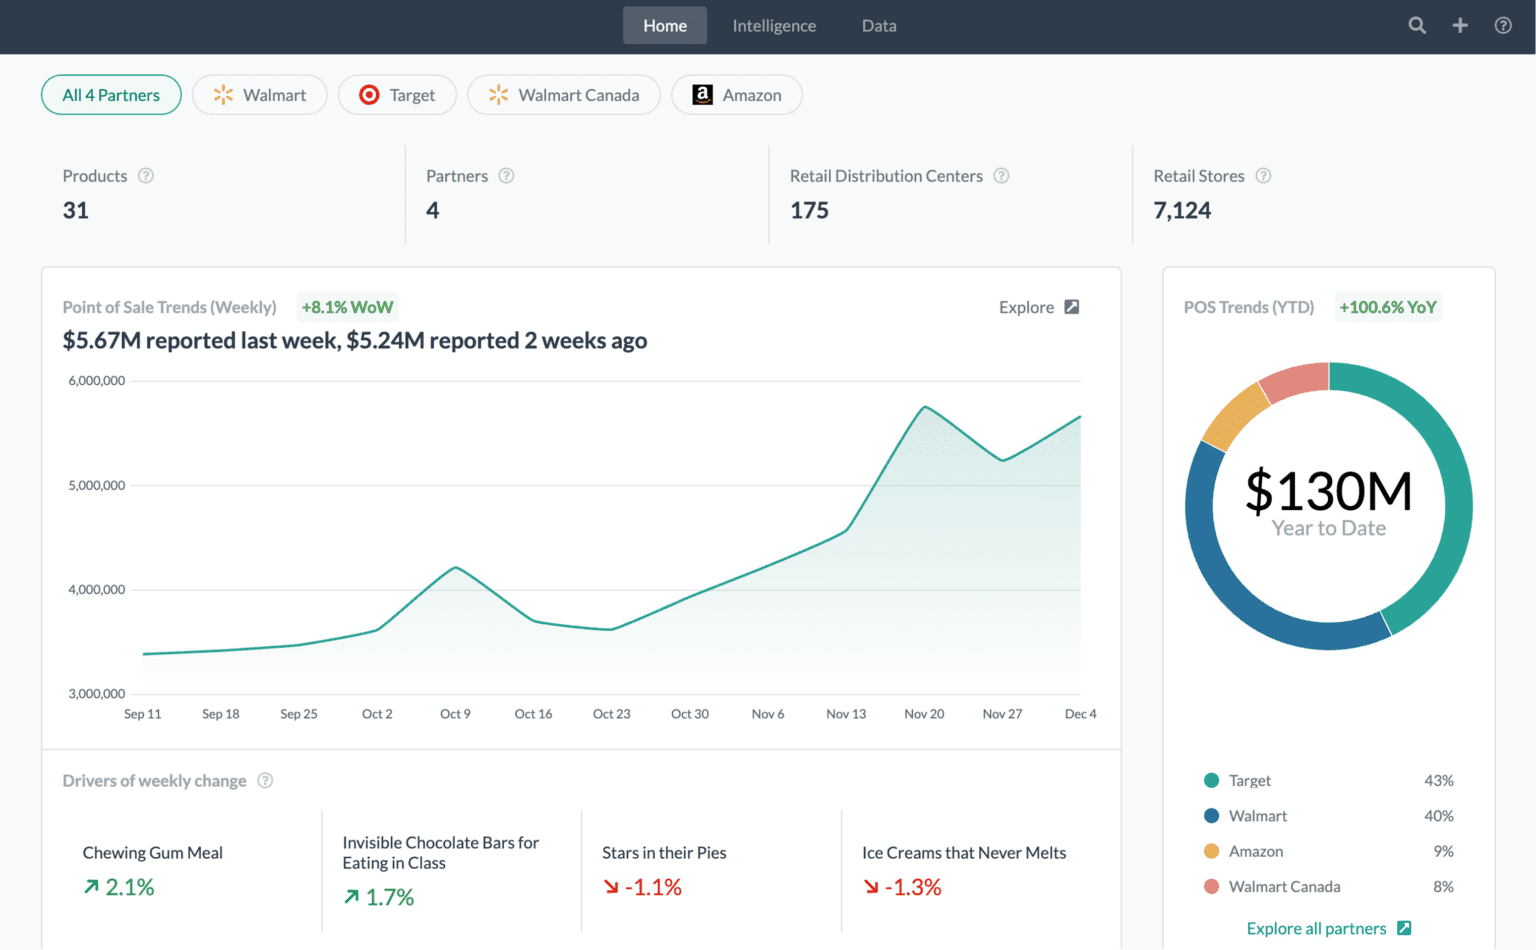
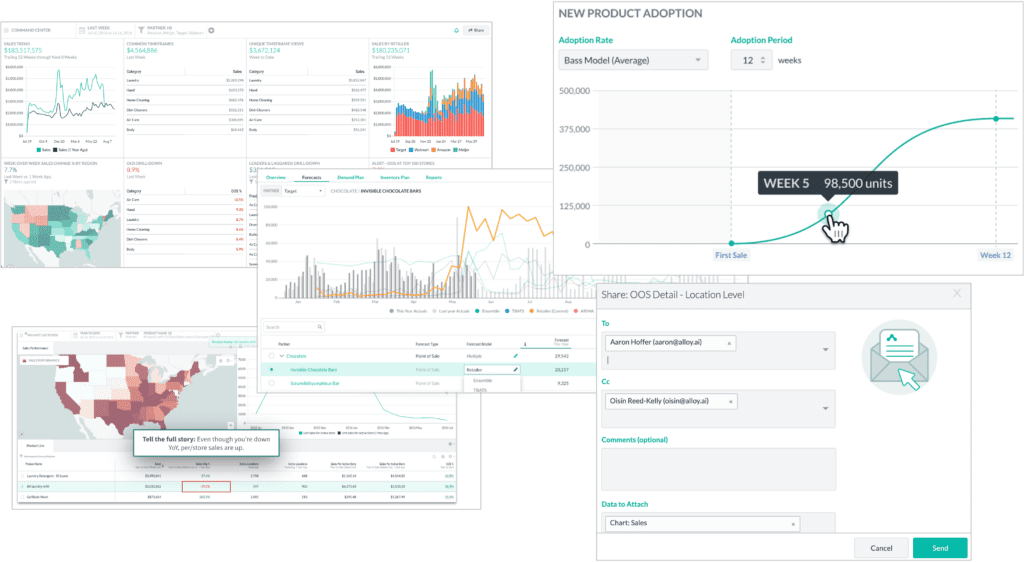
Data visualization in Alloy
Alloy.ai offers hundreds of out-of-the box consumer-goods derived metrics that are always as up-to-date as possible. We see that our category-leading customers are keeping a close eye on some of the following key metrics and are using them to make inventory and replenishment decisions daily:
- ☑️ Weeks of supply
- ☑️ Future weeks of supply
- ☑️ Lost sales (at Price)
- ☑️ Lost sales (at Cost)
- ☑️ Out of stock %
- ☑️ Forecast accuracy
- ☑️ % of Forecast
- ☑️ Gross margin
- ☑️ Active locations
- ☑️ Sales per store
- ☑️ Recommended order adjustments
- ☑️ Phantom inventory
- ☑️ ROI of in-store marketing
- ☑️ OTIF
Alloy.ai Customers Seeing Real Results
Valvoline
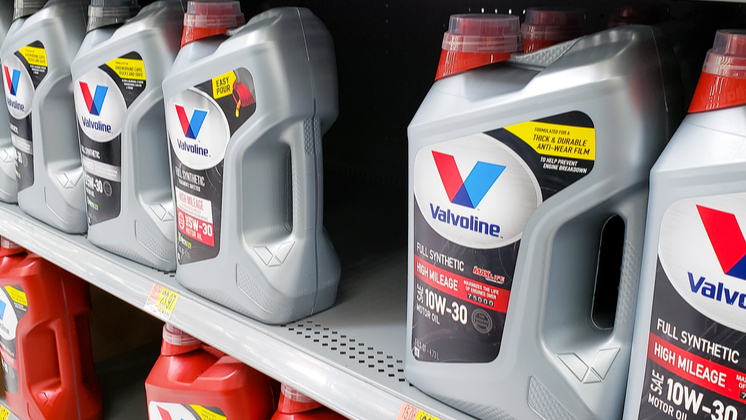
Reduced OTIF fines by $150K by using retail data in Alloy.ai to dispute fines.
Leading Global Food Brand

Increased total sales by $2.7M with better replenishment and collaborative inventory management in Alloy.ai
“We have had a lot of positive changes from Walmart, especially now that we have Alloy.ai. This is the main reason they are letting us run their orders now.”
-Valvoline analyst