Jason Miller Blog Post Part 1: Grocery stores aren’t gouging consumers – their costs are going up!..
It is my pleasure to begin this series of joint blog posts with Jason Miller, Associate Professor of Logistics at Michigan State University. Jason has been terrific about sharing new insights on the economy based on a variety of different government indices, and I thought this would be a great forum for discussion and review of data. Jason is an expert at mining government data that tells a story – but you have to look closely sometimes to see what is going on. His insights often suggests that a lot of the claims in the media or by government agencies are NOT supported by the data. Today’s blog is Part 1 of a series that should be of interest to those who follow supply chain trends and the press.
Our first blog explores grocery store food prices. There has been a lot of press claiming price gouging by grocery stores, and that the prices being paid at the cash register are somehow caused by greedy retailers. Consumers are suffering from sticker shock, a story noted in the local Raleigh news. One question that has come up from several people we spoke with (including economists) is whether there is indeed evidence of price gouging, especially by supermarkets. Jason also used this issue as an interesting case example for his capstone supply chain management students, and compiled all the data and taken an initial look. (He apologizes for not performing a formal statistical analysis with the time series data on pricing). However, the evidence he provides below by graphing multiple time series that are likely nonstationary, provides plenty of evidence that price gouging is NOT going on by grocery stores this year.
Consider the following observations:
[1]: The gross margin ratio [(selling price – cost of goods sold) / selling price] for Kroger, Publix, and Albertsons are down in 2021 from 2020. Year-to-date in 2021, Kroger’s gross margin ratio is 0.22, down from 0.234 through the same period of 2020 () . Publix shows a similar pattern; as of their most recent quarterly release, through the first nine months of 2021 Publix’s gross margin ratio is 0.277, down from 0.281 during the first nine months of 2020). Albertsons’ latest quarterly report shows that their gross margin ratio for the 28 weeks ended September 11, 2021 was 0.289, which is down from the gross margin ratio of 0.295 they had for the same period in 2020 (). If there was indeed price gouging going on, I would expect gross margin ratios to be higher.
[2]: The Bureau of Labor Statistics (BLS)’s satellite producer price index for food and beverage retailing shows that the input prices for food and beverage stores have risen 9.3% between October 2021 and January 2020. This is shown in Figure 1 below, In contrast, the selling prices for food and beverage stores have risen 6.8% over this period using data from the Bureau of Economic Analysis’ Table 7U, Chain-Type Price Indexes for BEA Retail and Food Service Sales (also shown in Figure 21 below). It is clear to see in this chart that the price increases are less than the associated price increases in inputs (prices from the food manufacturers that are being passed on to grocery stores). The key thing is that there is some time lag between inputs going up and selling prices increasing for various reasons discussed by Blinder et al. (1998) Another factor for higher prices is a recent sharp increase in labor prices for production and nonsupervisory employees (see Figure 2). We are all aware that wages have gone up – so the inflationary issues going on are occuring because grocery stores pay more for food due to higher prices, and also have higher costs of labor to operate the stores (when they can get people to come in who don’t have Covid!)
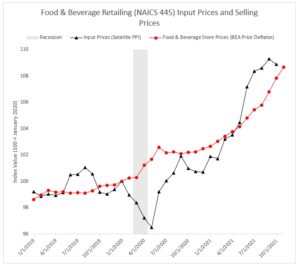
Figure 1 – Food and Beverage Input Prices and Selling Prices
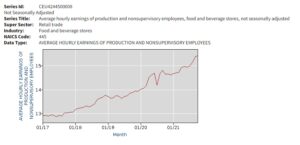
Figure 2 – Hourly Earnings – Food and Bev Employees
[3]: Looking further upstream in the supply chain, we see a similar pattern of cost pass-through. Looking first at grocery wholesale (where selling prices are from the BEA’s Table 2BUI. Implicit Price Deflators for Manufacturing and Trade Sales [Index base 2012, 1997 forward, NAICS] and the input price is the BLS’s producer price index for food manufacturing. [Note that there isn’t a satellite PPI for grocery wholesaling]. The pattern in this chart is very clear – one can see how wholesale prices are closely following the food manufacturing PPI. The same dynamic holds for food manufacturing, where the output price series is adjusting very closely to the satellite PPI measuring input prices. Drilling more fine grained to animal production (NAICS 112), we see a similar pattern: output prices appear to be moving upwards due to input costs increasing.
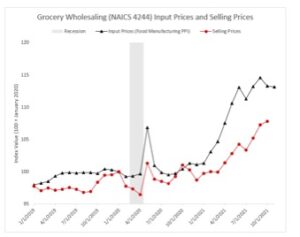
Figure 3 – NAICS 4244 Input Prices and Selling Prices
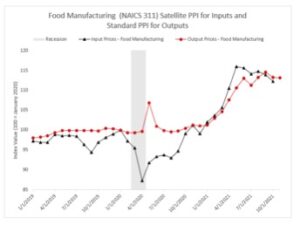
Figure 4 – NAICS 311 Satellite PPI for Inputs and Standard PPI for Outputs
The implications of these analyses? Grocery store prices are following closely the increased costs of food and grocery wholesale costs, which are going up. We know that food producers are passing on the increased costs of labor, transportation, food harvesting, food manufacturing, and distribution. Margins are thin – so there is not much a grocery store chain can do but pass on their costs to the consumer. This is a simple concept and goes by another name: inflation. It happens when there are shortages of products relative to demand – a concept you may have learned in Economics 101.
Unfortunately, there is likely no end in sight for food prices to continue to go up – expect more price increases in 2022.