Remove 2019 Remove Inventory Remove Manufacturing Remove Metrics
article thumbnail

Supply Chain Leaders Rearranging Deck Chairs? Yes, I Think So.

Supply Chain Shaman

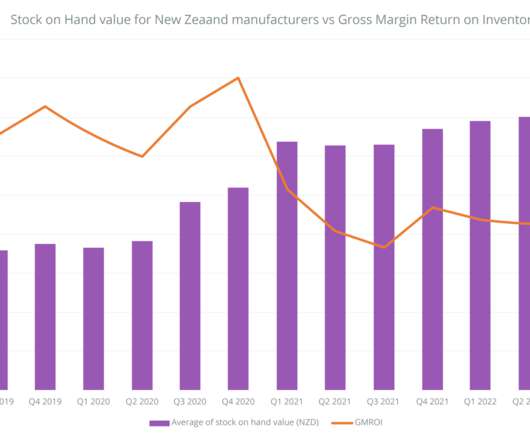
The supply chain is complex non-linear system that is easily thrown out of balance through a focus on functional metrics. They rock back and forth in improving singular metrics but struggle to improve a portfolio of growth, margin, inventory performance, and asset utilization. Comparing 2010-2019. Change metrics systems.

article thumbnail

A New Decade: Give Science A Chance

Supply Chain Shaman

Only four percent of companies compared to their peer groups improved balance sheet performance of growth, operating margin, and inventory turns. When compared to pre-recession years, we ended the decade with twenty more days of inventory. Days of Inventory Comparison. The first story is about a large regional food manufacturer.

Insiders

Sign Up for our Newsletter

This site is protected by reCAPTCHA and the Google Privacy Policy and Terms of Service apply.

article thumbnail

Uh-Oh! Insights On How P&G Failed And What This Means For You

Supply Chain Shaman

At each company, there is a relationship between the metrics of growth, margin, inventory, customer service, and asset strategy. For the purpose of this article, I will use Return on Invested Capital (ROIC) as the proxy metric to discuss asset utilization.) Yannis transitioned from the role after eight years in 2019.

article thumbnail

Supply Chain Performance Declined In the Last Decade. The Question is Why?

Supply Chain Shaman

of revenue on information technology (IT), only six percent of manufacturers drove performance at the intersection of growth and margin. Rise in Inventories. Less Effective at Inventory Management. Inventories grew twenty days over the decade. Sadly, most of it is the wrong inventory. Despite spending 1.1%

article thumbnail

The Manufacturers Health Check: Firms Holding Double the Stock Amidst ‘Inventory Crisis’

Unleashed

New manufacturing data has revealed which industries and nations are leading the way in the post-pandemic economic recovery – and the tactics they’re using to beat supply chain disruption. We did this by analysing four key metrics: The average value of total stock on hand – reflecting the volume of goods held (plus impacts from inflation).

article thumbnail

Decline In Performance in Consumer Products. Are You To Blame?

Supply Chain Shaman

On Thursday morning, I began an engagement with a food manufacturer attempting to drive “Supply Chain 2.0. Less than 15% of Companies use technologies to set targets for the form and function of inventory, and less than 29% of companies quickly access and manage total cost information. Shift functional metrics to focus on reliability.

article thumbnail

History Repeats Itself Without Supply Chain Leadership

Supply Chain Shaman

Frank, the line manager for manufacturing, dominated the meetings. Tom, the colorful warehouse manager, constantly heckled Frank for the increasing inventory levels while Ed, the quiet material/logistics manager, constantly questioned if there was a better way. The analysis covers the period from 2010 to 2019.