Remove Manufacturing Remove Metrics Remove New York Remove Transportation
article thumbnail

This Week in Logistics News (March 23 – 29)

Logistics Viewpoints

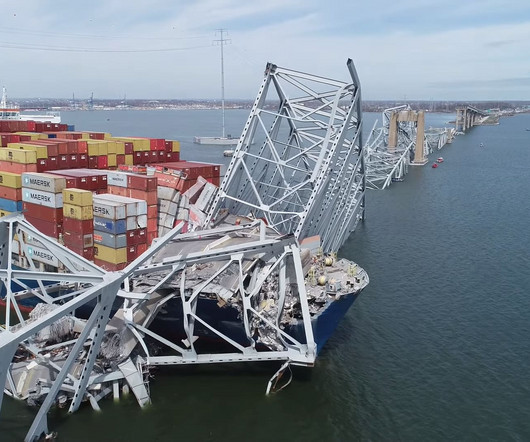
million vehicles cross the bridge annually, or about 30,000 per day, according to the Maryland Department of Transportation. These plants produce various food products, and these new projects’ technologies can be replicated across a wide range of food and beverage manufacturers. An estimated 11.5

article thumbnail

Top Solutions for Supply Chain Agility

Logistics Viewpoints

There can be surprises that potentially offer a better upside: demand is higher than expected, it is possible to raise prices without affecting demand based on what is happening with competitor products, technology has allowed manufacturing capacity to ramp up faster than expected, etc. E2open acquired BluJay Solutions in May of 2021 for $1.7

Insiders

Sign Up for our Newsletter

This site is protected by reCAPTCHA and the Google Privacy Policy and Terms of Service apply.

article thumbnail

This Week in Logistics News (October 1 – 7)

Logistics Viewpoints

The goal is to reduce or avoid one billion metric tons (a gigaton) of greenhouse gasses from the global value chain by 2030. The six areas are energy use, nature, waste, packaging, transportation, and product use and design. And Walmart recently rolled out extra levies for suppliers using its transportation services.

article thumbnail

Guest Commentary: Tight Transportation Capacity, Not Flagging Demand, Behind ISM Report Showing Slowing Activity

Talking Logistics

Analysts point to the steep decline in orders for new transportation equipment as evidence that manufacturers are seeing weakness. In reality, it may not be softening demand at the root of manufacturers’ slowdown in the bookings for new trucks, trailers and other equipment. On one hand, new orders for U.S.

Capacity 138
article thumbnail

2024 Supply Chain Economic Update

American Global Logistics

With that, let’s turn to and analyze PMI-Manufacturing. Key Economic Indicator #5: PMI-Manufacturing The S&P Global US Manufacturing PMI for December 2023 decreased to 47.9 Flash US Manufacturing Output Index. Flash US Manufacturing PMI. This flash metric registered at 50.3 Data is as of December 2023.

article thumbnail

Reports of Easing Global Supply Chain Volatility in July

Supply Chain Matters

The overall takeaway from the July data was that global production momentum had begun to stagnate and in some regions such as the Eurozone, Taiwan, and to some extent , certain manufacturing regions of China, PMI values had reached contraction levels. . Warehousing and Inventory metrics continue to buoy the logistics sector.

article thumbnail

Economic Update — June 2023

American Global Logistics

With that let’s turn to and analyze PMI-Manufacturing. Key Economic Indicator #5: PMI-Manufacturing The S&P Global US Manufacturing PMI for June 2023 reached a six-month low of 46.3 This decline was primarily because of a drop in output, new orders, and suppressed demand. That’s the national labor snapshot for June.