Remove 2009 Remove Inventory Remove Manufacturing Procurement Remove Procurement
article thumbnail

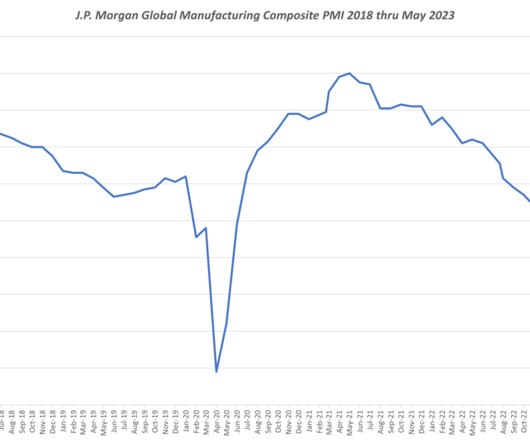
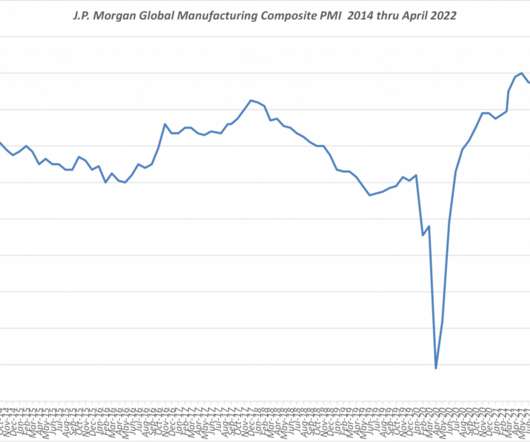
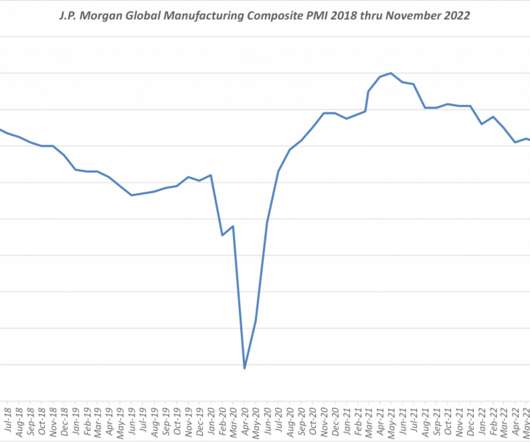
July 2022 Global Manufacturing Indices Indicating Declining Momentum

Supply Chain Matters

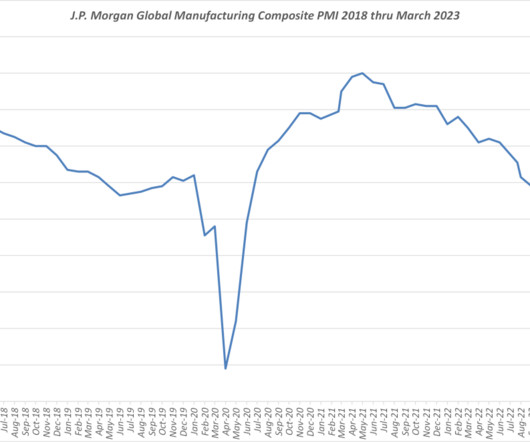
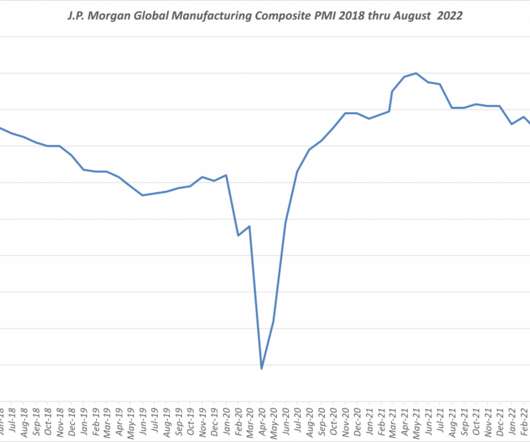
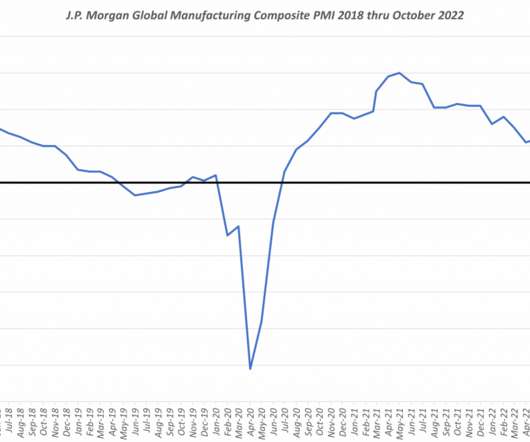
The Supply Chain Matters blog provides commentary relative to July’s global manufacturing PMI indices relative to data indicating declining momentum, and some contraction among specific global regions. Morgan Global Manufacturing PMI® report, a composite index produced by J.P. Global Wide Production Activity. The July 2022 J.P.

article thumbnail

Global Manufacturing Activity Levels Continue to Stabilize in March and Q1-2023

Supply Chain Matters

However, we discern some added signs excess inventories and of production sourcing shifts. Global Manufacturing Activity Levels Global manufacturing activity as reported by the J.P. From our lens, the latter is evidence of recessionary manufacturing conditions that are now stabilizing. That stated, the reported 49.6

Insiders

Sign Up for our Newsletter

This site is protected by reCAPTCHA and the Google Privacy Policy and Terms of Service apply.

article thumbnail

August 2022 Global Manufacturing Indices- Declining Momentum Accelerating

Supply Chain Matters

Supply Chain Matters provides our commentary and perspectives on published monthly global manufacturing PMI and supply chain activity indices. Morgan Global Manufacturing PMI® report, a composite index produced by J.P. The August S&P Global US Manufacturing PMI™ again fell to a two-year low of 51.5, The August 2022 J.P.

article thumbnail

October 2022 PMI Reporting Points to Global Wide Manufacturing Contraction

Supply Chain Matters

Supply Chain Matters provides monthly highlight commentary and perspectives on published October 2022 global manufacturing PMI and supply chain activity indices. Now, October reporting data reinforces global-wide contraction levels in production and new orders, along with manufacturing recession conditions now acknowledged for Europe.

article thumbnail

Using Digital Supply Chain Planning to Respond to Market-Changing Disruptions like COVID-19

ToolsGroup

Gartner research shows that companies that continued to increase earnings while others declined in 2009 and 2010 were those that were able to keep their foot on the gas through the downturn because they had planned responses in advance. One US-based ToolsGroup manufacturing customer sources parts from several Chinese and Italian suppliers.

article thumbnail

Who Should Be In The Winner’s Circle?

Supply Chain Shaman

When Gartner purchased AMR Research in December 2009, the methodology became the Gartner Supply Chain Top 25. Only 29% of manufacturers easily manage total cost trade-offs. After six months of analysis, we decided the best fit was the combination of growth, inventory turns, operating margin, and Return on Invested Capital.

Gartner 239
article thumbnail

Let the Qs Begin

Supply Chain Shaman

While the performance rankings were based on comparisons of inventory turns, operating margin and Return on Invested Capital (ROIC) for the periods of 2006-2013 and 2009-2013, the concept is that to be a supply chain leader you must outperform and drive improvement. How do you balance the trade-offs between source, make and deliver?