Remove 2007 Remove Metrics Remove Procurement Remove Warehousing
article thumbnail

How We Stubbed Our Toe in The Evolution of S&OP

Supply Chain Shaman

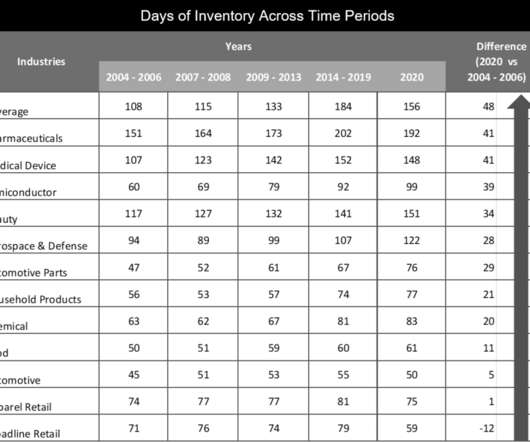
Industries carried on average 32 days more inventory in 2020 than in 2007. (I Organizations can align to drive value despite the allegiance to functional metrics. Why do we have 32 days more inventory by company in 2020 than in 2007? Ironically, the organization efficiently produces goods that will only sit in the warehouse.

S&OP 195
article thumbnail

Collaboration? When It Comes to Cash-to-Cash, We Don’t Know How to Walk the Talk

Supply Chain Shaman

Cash-to-Cash Metrics. Cash-to-cash is a compound metric: (Days of Receivables+Days of Inventory)-Days of Payables=Cash Conversion Cycle. While touted as a digital procurement provider, it took the Company nine days to onboard me as a vendor, and two weeks to process a Purchase Order. In times of uncertainty, cash is king.

Insiders

Sign Up for our Newsletter

This site is protected by reCAPTCHA and the Google Privacy Policy and Terms of Service apply.

article thumbnail

2020 Requires Big Wings and Feet

Supply Chain Shaman

The design of the conference includes tours of several modern warehouses and centers of excellence. No metric should be measured in isolation, and functional metrics should be replaced with the balanced scorecard metrics shown in Figure 2. 5 A Focus on Functional Metrics Throws the Supply Chain Out of Balance.

article thumbnail

Spreadsheets – A Look Back

Kinaxis

A poor procurement choice based on stale data can lead to a decline in profits. From our eBook, S&OP in the 21st century , “An audit of 50 corporate spreadsheets in 2007 revealed that 94% had errors… one for $100 million!” That could mean excess inventory sitting in a warehouse, gathering dust or depreciating.