Remove 2009 Remove 2020 Remove Chemicals Remove Metrics
article thumbnail

Who Should Be In The Winner’s Circle?

Supply Chain Shaman

When Gartner purchased AMR Research in December 2009, the methodology became the Gartner Supply Chain Top 25. The methodology did not include a peer group analysis, and I strongly felt that chemical, retail, and telecommunications companies should not be compared in the same analysis. The result? The reason? Is this leadership?

Gartner 239
article thumbnail

The Manufacturers Health Check: Firms Holding Double the Stock Amidst ‘Inventory Crisis’

Unleashed

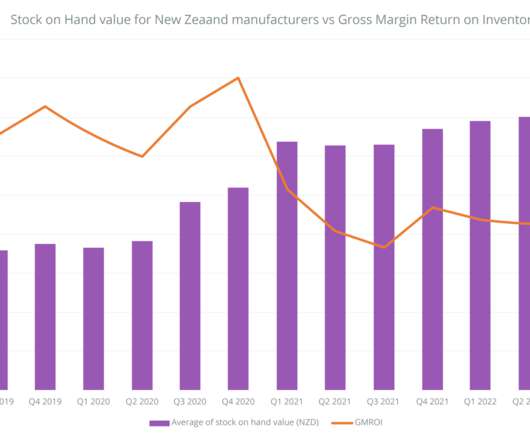
Gross Margin Return on Inventory (GMROI), a profitability metric that accounts for unsold inventory, has now dropped in all three countries as manufacturers abandon the Just In Time business model for the more costly Just In Case approach. Fulfilment days – the period between receiving and fulfilling an order.

Insiders

Sign Up for our Newsletter

This site is protected by reCAPTCHA and the Google Privacy Policy and Terms of Service apply.

article thumbnail

L’Oreal: A Beautiful Supply Chain

Supply Chain Shaman

In the process of compiling the Supply Chains to Admire report for last year’s Supply Chain Insights Global Summit , the research team at Supply Chain Insights calculated the rate of supply chain improvement of companies by industry for the period of 2006-2013 and 2009-2013. We studied this pre and post-recession.

article thumbnail

The Unleashed Manufacturing Health Index: Signs of Recovery as 2023 Closes

Unleashed

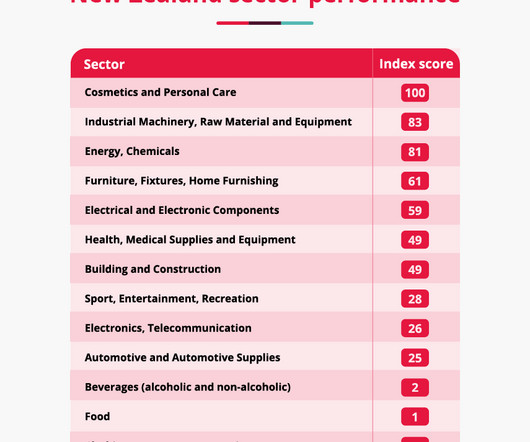
Index figures are calculated from a combination of core performance metrics, including sales performance, purchasing and internal efficiency. Heavy industry is also leading the way with high scores seen in Industrial Machinery, Raw Material and Equipment ; Plastics and Rubber ; Building and Construction , and Energy and Chemicals.

article thumbnail

100+ Supply Chain Crisis Statistics: Raw Materials, Covid-19, Labor Shortages, and More

ToolsGroup

In Fortune 500 earnings calls for Q3 of 2021, “supply chain” mentions were up 412% from Q3 in 2020. 28% of global retailers have tried to find alternative sourcing options due to supply chain issues (RetailNext, 2020). higher than 2020. As of 2020, only 12% of semiconductor chips were made in the United States. (