Remove 2009 Remove Benchmarking Remove Metrics Remove Procurement Analytics
article thumbnail

Who Should Be In The Winner’s Circle?

Supply Chain Shaman

When Gartner purchased AMR Research in December 2009, the methodology became the Gartner Supply Chain Top 25. The first step was to charter a research project with the Arizona State University statistics department to analyze which combination of metrics drives the highest market capitalization. The result? The reason?

Gartner 239
article thumbnail

Uh-Oh! Insights On How P&G Failed And What This Means For You

Supply Chain Shaman

At each company, there is a relationship between the metrics of growth, margin, inventory, customer service, and asset strategy. For the purpose of this article, I will use Return on Invested Capital (ROIC) as the proxy metric to discuss asset utilization.) Understanding this relationship requires modeling. (A A Case Study.

Insiders

Sign Up for our Newsletter

This site is protected by reCAPTCHA and the Google Privacy Policy and Terms of Service apply.

article thumbnail

The End of a Fairy Tale

Supply Chain Shaman

When you run the graphs, there is marked difference for these companies that begins to appear in 2009. However, none of the three companies knew this before the benchmarking activity. When I go in to help a company, I first benchmark their supply chain ratios. My preference is monthly as part of the S&OP process.).

article thumbnail

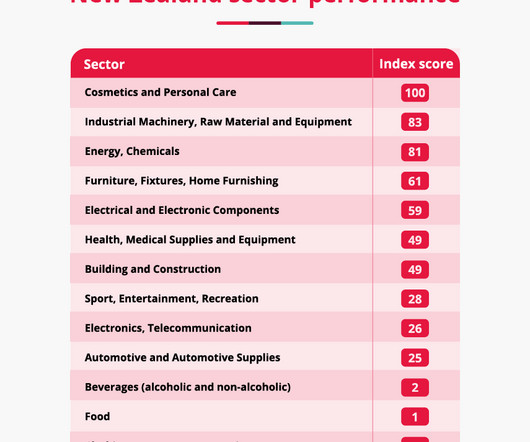
The Unleashed Manufacturing Health Index: Signs of Recovery as 2023 Closes

Unleashed

Index figures are calculated from a combination of core performance metrics, including sales performance, purchasing and internal efficiency. Quarterly performance is then benchmarked against the nine previous quarters. Founded in New Zealand in 2009 it was acquired by the UK’s Access Group in November 2020.

article thumbnail

100+ Supply Chain Crisis Statistics: Raw Materials, Covid-19, Labor Shortages, and More

ToolsGroup

82% of people have concerns that the supply chain will ruin life plans, such as birthdays, vacations, holidays, and the purchasing of necessary items. As some component lead times push into 2023, the shortage is expected to last 24 months before it recedes – similar to the chip shortage of 2008-2009. Chain Store Age ). AlixPartners).