article thumbnail

The Fight of the Titans

Supply Chain Shaman

Figure 1: Supply Chain Metrics Are a Balancing Act. The metrics shown in Figure 1 are difficult to improve together. Most companies improve singular metrics but are not able to drive portfolio. Here I show orbit chart comparisons at the intersection of operating margin and inventory turns for the period of 2006-2017.

article thumbnail

How Can You Seize Opportunity If You Cannot Manage Risk?

Supply Chain Shaman

Companies with the lower score on the Index are driving faster rates of metrics improvement. Energizer and Unilever are driving the fastest rates of improvement and Clorox and P&G improvement rates are the slowest on the Metrics That Matter of Growth, Operating Margin, Inventory Turns, and Return on Invested Capital (ROIC)).

Insiders

Sign Up for our Newsletter

This site is protected by reCAPTCHA and the Google Privacy Policy and Terms of Service apply.

article thumbnail

Help Supply Chain Planners Be More Successful In These Uncertain Times

Supply Chain Shaman

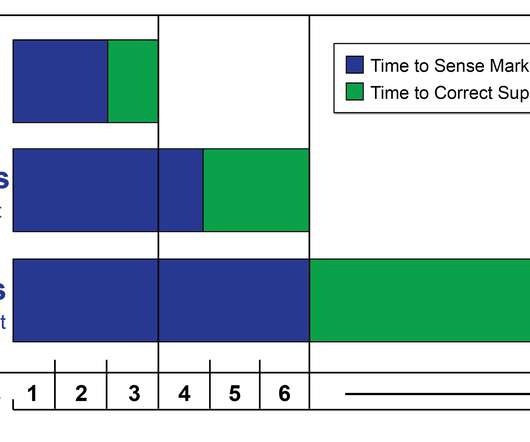
With the downturn in the financial markets, the looming recession, and the fundamental shifts in demand—less travel and stay at home work policies—demand is changing. In the downturn of the market in 2017, it took the average supply chain six months to adjust, I expect alignment with this shift to be worse.

article thumbnail

Supply Chain Diagnostic: A Four-Step Process

Supply Chain Shaman

In Figure 1, we show the aggregate trend of the chemical industry in an orbit chart format showing year-over-year results at the intersection of two metrics operating margin and inventory turns. Orbit Chart for the Chemical Industry for the Period of 2010-2017 at the Intersection of Inventory Turns and Operating Margin.

article thumbnail

Good People Can Make A Difference In Outcomes

Supply Chain Shaman

As I facilitated the class and discussed the findings , the theme of data sharing and demand management was prevalent. Most companies have applied the regional practices of demand management to global teams. The 2017 Gartner Top 25 beauty contest is over. The content focused on the end-to-end supply chain.

article thumbnail

When The Wheels Fall Off

Supply Chain Shaman

In 2017, when I moved, I bought an old car. Bring up a parallel demand management solution using market data (point of sale, distributor data, and market indicators) and look for trends. Make this demand management an operational desktop tool and don’t tie it into traditional IT systems. Use Channel Data.