article thumbnail

Measuring Up?

Supply Chain Shaman

To help, in this post, we provide you with some insights for the period of 2006-2015. The supply chain is a complex system with finite, and non-linear relationships between supply chain metrics that drive balance sheet results. The analysis is for two time periods: 2006-2015 and 2009-2015. Economic Vision of Supply Chain 2030.

article thumbnail

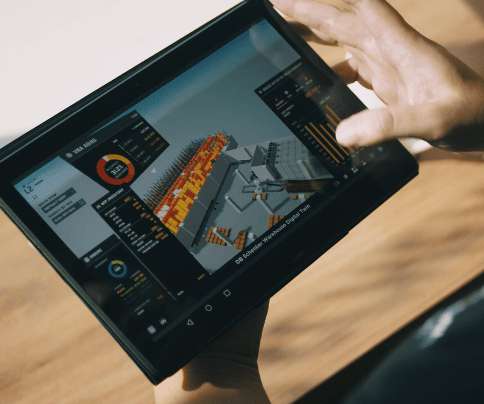
DB Schenker – Singapore: A Vital Node in Singapore’s Logistics Ecosystem

The Logistics & Supply Chain Management Society

One of the key achievements in 2020 was the automation systems commissioning and go-live of the integrated Red Lion facility in May – at the height of the pandemic. With multiple automation systems in place and various sub-systems requiring seamless integration. Climate change is one of the biggest challenges of our generation.

Singapore 246
Insiders

Sign Up for our Newsletter

This site is protected by reCAPTCHA and the Google Privacy Policy and Terms of Service apply.

article thumbnail

Household Products Industry Stuck in Neutral and Going Backwards

Supply Chain Shaman

Orbit Chart for Kimberly-Clark and P&G for the Period of 2006-2015. Orbit Chart of Colgate for the Period of 2006-2015. Let’s take the case of Cisco Systems. Caught in this e-commerce hype, Cisco Systems did not foresee the bubble getting ready to burst in 2001. Orbit Chart of Cisco Systems.

article thumbnail

Groundhog Day

Supply Chain Shaman

When full-year public data becomes available in April, we take each industry and analyze results over the period of 2006-2015. Last year, six companies have made the two lists: Cisco Systems, Intel, L’Oreal, Nike, Samsung, and Walmart. Economic Vision of Supply Chain 2030. Supply Chain 2030. New Business Models.
Gartner 158
article thumbnail

Two Million Vacant Manufacturing Jobs by 2025…How Can We Tackle the Skills Gap?

GlobalTranz

And, there is a nationwide shortfall of candidates prepared for work in the modern manufacturing environment of computerization, sophisticated robotics, 3D printing, and other technologies designed to streamline systems and automate processes. Global Labor Market Status. Meanwhile, the U.S.

article thumbnail

Why Energy Supply Chains are Transitioning to Renewables

Requis

In spite of the increased spend, production has not risen but declined 6% between 2006 and 2012. Although the share of renewables in global electricity generation reached almost 27% in 2019, renewable power as a whole still needs to expand significantly to meet the SDS share of almost half of generation by 2030.”

article thumbnail

How Can We Heal the Global Supply Chain?

Supply Chain Shaman

In my work tonight, I carefully studied 2006-2015 financial results to select the Supply Chains to Admire winners. Higher percentage of growth than the industry average for the period of 2006-2015. Greater margin performance than the industry average for the peer group for the period of 2006-2015. Operating Margin.