Remove 2007 Remove Forecasting Remove Government Remove Metrics
article thumbnail

Supply Chain Performance Declined In the Last Decade. The Question is Why?

Supply Chain Shaman

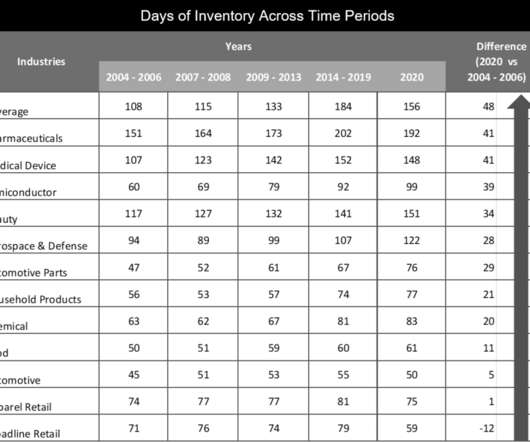
Yes, companies held more inventory (measured in days of inventory) in 2019 than at the start of the 2007 recession. Commercial and operating teams in manufacturing organizations greater than 5B$ in annual revenue were more aligned in 2007, at the beginning of the recession, than in 2020, the start of the pandemic. Alignment Barriers.

article thumbnail

Supply Chain Leaders, Chained to Tradition, Face the Whip

Supply Chain Shaman

One of my stark realizations this year is that smaller companies are beating larger and often more established companies on growth metrics, inventory turns, operating margin, and Return on Invested Capital (ROIC). (In The metrics selection resulted from work with Arizona State University in 2013.) Look for the full report next week.).

Insiders

Sign Up for our Newsletter

This site is protected by reCAPTCHA and the Google Privacy Policy and Terms of Service apply.

article thumbnail

How We Stubbed Our Toe in The Evolution of S&OP

Supply Chain Shaman

Tight coupling of the supply chain forecast to the financial forecast will improve value. Industries carried on average 32 days more inventory in 2020 than in 2007. (I Organizations can align to drive value despite the allegiance to functional metrics. Without clear governance, customer data never sees the light of day.

S&OP 195
article thumbnail

Is A Customer-Centric Strategy the Same as Demand-Driven? Outside-In?

Supply Chain Shaman

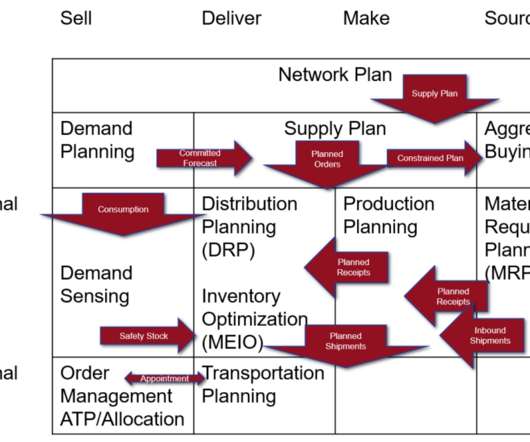
A Demand-Driven Value Network as defined by AMR Research in 2007: A network that senses demand with minimal latency to drive a near real-time response to shape and translate demand. A value network governed and defined by customer segmentation and a clear understanding of what drives value for the customer. Market-Driven Processes.

article thumbnail

How Can We Heal the Global Supply Chain?

Supply Chain Shaman

The winners drive improvement while posting financial results in the Supply Chain Metrics That Matter ahead of the peer group. The performance factors evaluated in the analysis are: Growth. (If you trace the year-over-year pattern, you can see that P&G made progress on inventory turns and operating margin 2006-2007, 2009-2010.