Remove 2007 Remove Metrics Remove Study Remove Warehousing
article thumbnail

How We Stubbed Our Toe in The Evolution of S&OP

Supply Chain Shaman

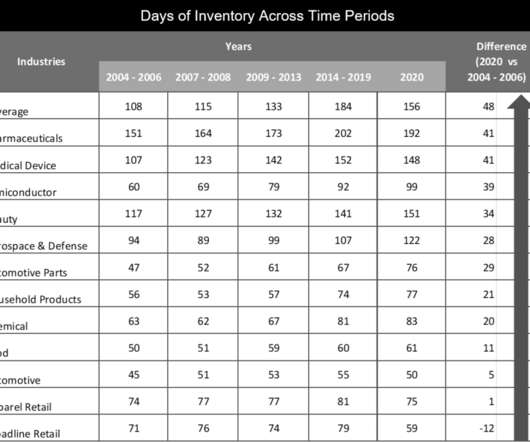
Forty interviews and two quantitative studies helped me build the model in my mind. Industries carried on average 32 days more inventory in 2020 than in 2007. (I Organizations can align to drive value despite the allegiance to functional metrics. Why do we have 32 days more inventory by company in 2020 than in 2007?

S&OP 195
article thumbnail

2020 Requires Big Wings and Feet

Supply Chain Shaman

The design of the conference includes tours of several modern warehouses and centers of excellence. The data in Table 1 is from a recent research study. No metric should be measured in isolation, and functional metrics should be replaced with the balanced scorecard metrics shown in Figure 2. The takeaway?

Insiders

Sign Up for our Newsletter

This site is protected by reCAPTCHA and the Google Privacy Policy and Terms of Service apply.

article thumbnail

Sales and Operations Alignment: Often The Missing Link

Supply Chain Shaman

I first met Shane in 2007 at the beginning of his work with Syngenta’s value chain. In 2007, Shane Emms was asked to take a Global Supply Chain leadership assignment at Syngenta. He led the team during the period of 2007-2009. The company’s focus is on biotechnology and genomic research. Shane’s Story.

article thumbnail

Building Outside-In Processes

Supply Chain Shaman

For example, in the recession of 2007, DuPont missed the downturn in the market. Study these pattern shifts daily and weekly. Include the supplier’s warehouse and manufacturing locations. With the completion of each study we share the research results. How can you build market-driven forecasting processes?

article thumbnail

VTech: A Story of a Supply Chain Leader

Supply Chain Shaman

Through the next two months, I am focusing on writing and sharing case studies of success. I will write the case studies here, and share the dialogue with the supply chain leaders in our podcast series, Straight Talk with Supply Chain Insights. Better performance in inventory turns than the peer group average for the period studied.

article thumbnail

3 Initiatives Driving Sustainable Transportation and Logistics Management

BlueYonder

Recent studies have shown that transportation is the single largest source of greenhouse gas emissions in the United States. In 2007, the U.S. Department of Energy calculated that CO2 emissions from transportation surpassed two billion metric tons ; it’s hard to imagine what that number looks like today.